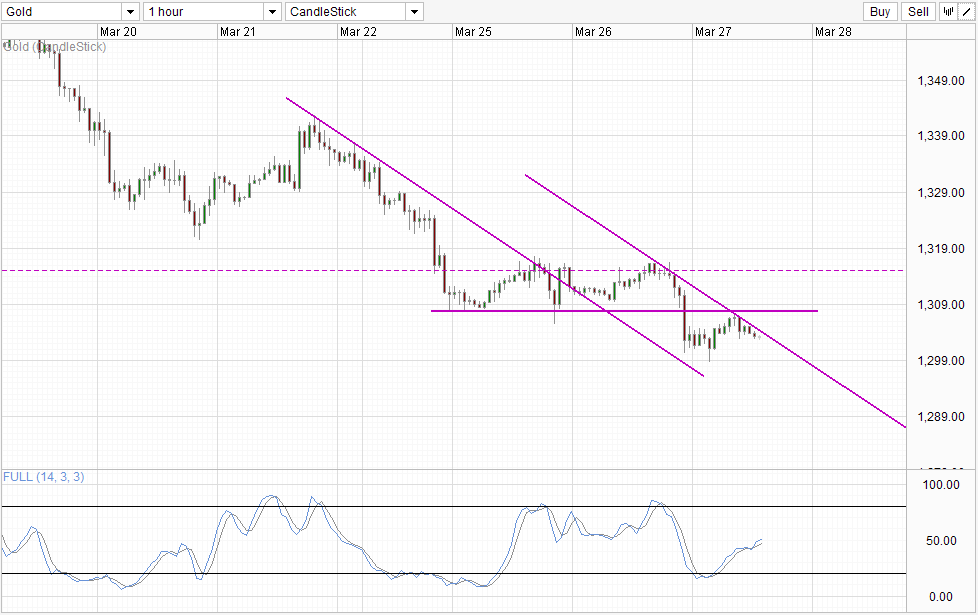
Gold prices took yet another significant bearish step, pushing below the soft support of $1,308 and tagged below $1,300 for the first time since Valentine's Day. Once again, the bearishness in Gold is plain for all to see as prices should have climbed higher or at the very least remained supported given that US stocks were mostly bearish yesterday. However, this shouldn't really be that surprising as yesterday was not the first time Gold prices pushed lower despite negativity in the market.
Hourly Chart
It is not as though Gold is immune to risk trends. Case in point, Asian equities were extremely bearish early this morning with the Nikkei 225 shedding more than 1% initially while other major indexes such as the Hang Seng Index and Australia's ASX were not far behind. This coincided with a slight bullish rebound in Gold which is in line with risk trends. Certainly there may be a chance this may simply be a coincidence as $1,300 is a strong support level, and as such a rebound was reasonably expected, whether risk trends are supportive or not. Nevertheless, Gold prices are pushing lower right now - in line with a sharp recovery of Asian stocks which sees Nikkei 225 reversing the 1% loss into a 1% gain along with recoveries in all Asian indexes. Hence, the likelihood of this being a coincidence becomes lower, which highlights the bearish strength even more.
Technical traders may scoff at the above analysis, and say that it's simply prices rebounding off $1,308 resistance and the Channel Top adding additional pressure. But the conclusion is still the same - a strong bearish sell off can be expected moving forward, likely occurring during the early US session once again with 1,300 breaking.
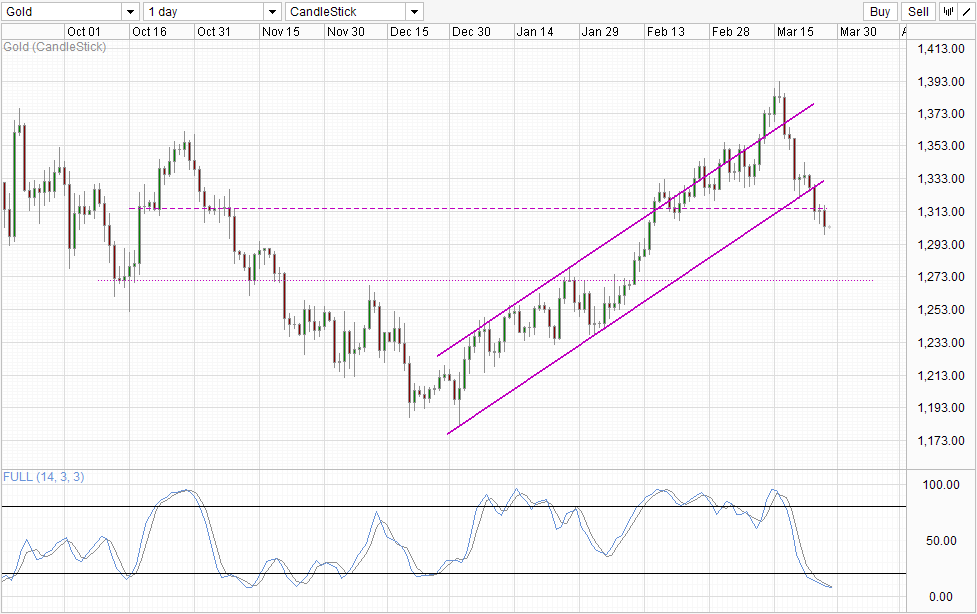
Daily Chart
The Daily Chart suggests that the bearish breakout has already happened, as $1,315 is a much more relevant support compared to the $1,300 round figure. The Stochastic curve appears to be slowing down and may reverse soon, but the risk of a bullish cycle emerging is low as counter-trend signals from cyclical indicator such as Stochastics is not reliable when there is strong directionality. Nonetheless, for traders who have yet to hold any short positions, they may need to wait for further confirmation of bearish conviction as entry signals. This is because a pullback to $1,315 is still possible, especially if $1,300 is not broken in the short-term. Hence traders who short Gold right now may be caught out. A more conservative approach may be to wait for $1,300 to break which will result in a bearish continuation in the short-term or for a confirmation of $1,315 support turned resistance holding.


