Gold – Thursday 23 July 2015
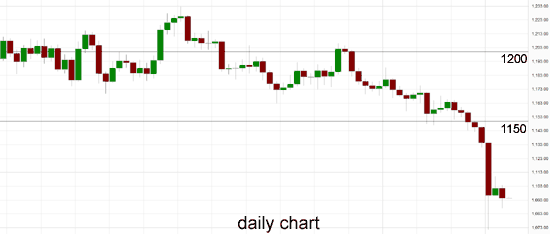
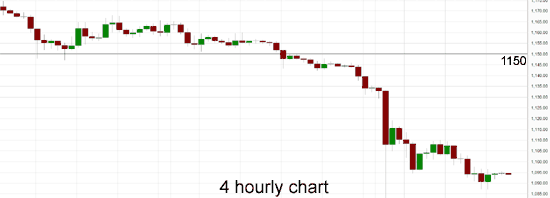
Throughout the last few weeks gold has steadily declined and fallen from above the key $1200 level back to a new five year low below $1100 earlier this week. Several days ago gold fell sharply through the $1100 level down to the multi-year low near $117 before rallying back up towards $1100. It is presently consolidating in a narrow range around $1095. Throughout last week it enjoyed solid support from the $1150 level which stopped the sharp falls and allowed it to rally a little higher up to above $1160. During this time it has rallied higher but run into resistance at $1160 which has sent it lower again. To finish out a couple of weeks ago it was able to rally against the medium term down trend and move back above the $1170 level before easing off again. A couple of weeks ago it surged higher to back above the key $1180 level before easing lower again. In the few days prior gold had been easing back to below the key $1200 level after recently surging higher to a three week high above $1205.
The $1200 level remains significant and is continuing to place selling pressure on gold and likely the $1180 level now too. Prior to the surge and in the last few weeks gold has been content to trade around the key $1180 level. Several weeks ago it rallied well to move from a two month low near $1160 back up to above $1190 again before easing back to the $1180 level. The key $1180 level has consistently provided solid support and has held it up now for a couple of months, with the exception of the recent excursion below. About a month ago gold fell sharply back through the key $1200 level and spent the remainder of that week consolidating in a narrow range around $1190. The $1200 level has been a significant level throughout most of this year and remains a key level presently offering reasonable resistance to higher prices, whilst lower the $1180 level continues to be significant. Throughout the last month or so the $1180 level has provided some support and has been called upon recently.
Earlier in May it was able to make a run through the $1200 level to reach a three month high above $1230 however gold was quickly sold off and returned back to the $1200 level where it enjoyed some support for several days. For around two months through April gold traded in a range between $1180 and around $1220 and had very few excursions outside these limits. Gold is currently pinned between resistance at $1200 and support at $1180 and it is surprising to see it trade in such a narrow range for several days. It seems it is waiting patiently for external factors to determine which level will be severely tested next.
(Daily chart / 4 hourly chart below)
Gold July 23 at 02:10 GMT 1094.1 H: 1095.5 L: 1093.7
Gold Technical
| S3 | S2 | S1 | R1 | R2 | R3 |
| — | — | — | 1200 | 1240 | — |
During the early hours of the Asian trading session on Thursday, gold is trading in a narrow range just below $1100 around $1095 after recently dropping to a new multi-year low near $1070. trading right above $1095.
Further levels in both directions:
• Below:
• Above: 1200 and 1240.
OANDA’s Open Position Ratios
(Shows the ratio of long vs. short positions held for gold among all OANDA clients. The left percentage (blue) shows long positions; the right percentage (orange) shows short positions.)
The long position ratio for gold has moved back to 65% as Gold has dropped sharply to below the $1100 level. The trader sentiment is strongly in favour of long positions.
Economic Releases
- 08:30 UK BBA Mortgage Approvals (23rd-28th) (Jun)
- 08:30 UK Retail Sales (Jun)
- 10:00 UK CBI Distributive Trades (23rd-27th) (Jul)
- 12:30 CA Retail Sales (May)
- 12:30 US Initial Claims (18/07/2015)
- 14:00 EU Flash Consumer Sentiment (Jul)
- 14:00 US Leading Indicator (Jun)


