Gold for Tuesday, March 31, 2015
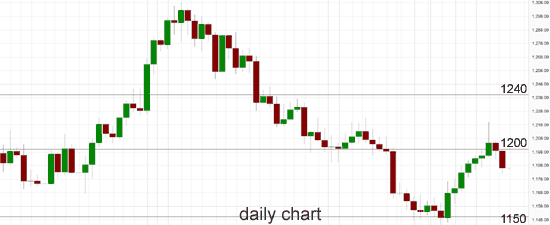
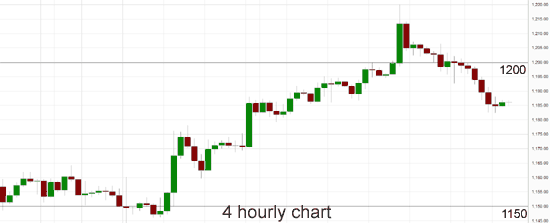
For the best part of the last couple of weeks gold has moved strongly off the support at $1150 up to a three week high right around $1220 level, before easing lower back towards the key $1200 level to finish out last week. It has started this week easing lower below $1200 falling sharply in the last 24 hours or so back down around $1185. It still has its eyes firmly on the key $1200 level and it will be interesting to see whether it can remain within reach of this level. Prior to the recent move, gold remained quite steady enjoying strong support from the $1150 level whilst some eyes would have been looking lower. The next obvious technical support level lower is around $1130, and if it was to move through this level, then it would be trading at multi-year lows and looking very bearish. When gold broke through the rock solid support level at $1200 recently, it opened itself up to some potential downside which was played out a couple of weeks ago.
Throughout the second half of February gold enjoyed rock solid support from the key $1200 level which held it up on numerous occasions. For about a month gold drifted steadily lower down to a one month low near the key $1200 level before finding the solid support at this key level. At the beginning of December gold eased lower away from the resistance level at $1240 yet again back down to below $1200. During the second half of November gold made repeated runs at the resistance level at $1200 failing every time, before finally breaking through strongly. Throughout the first half of November Gold enjoyed a strong resurgence back to the key $1200 level where it has met stiff resistance up until recently.
Throughout the second half of October gold fell very strongly and resumed the medium term down trend falling from above $1250 back down through the key $1240 level, down below $1200 to a multi year low near $1130. It spent a few days consolidating around $1160 after the strong fall which has allowed it to rally higher in the last couple of weeks. Earlier in October Gold ran into the previous key level at $1240, however it also managed to surge higher to a five week high at $1255. In late August Gold enjoyed a resurgence as it moved strongly higher off the support level at $1275, however it then ran into resistance at $1290. In the week prior, Gold had been falling lower back towards the medium term support level at $1290 however to finish out last week it fell sharply down to the previous key level at $1275.
Gold closed down for a second straight session as the dollar climbed on increasing prospects that the Federal Reserve may start raising interest rates gradually this year. In a speech on Friday, Fed Chairwoman Janet Yellen said an increase in the Fed’s benchmark rate “may well be warranted later this year” given sustained improvement in U.S. economic conditions. “It seems the market is once again focusing on the Fed raising rates,” Deutsche Boerse’s MNI senior analyst Tony Walters said. Gold, which does not pay any interest, has benefited from a low interest rates environment and central banks’ accommodative policies in the years following the 2008-2009 credit crunch. Spot gold fell as low as $1,182.90 an ounce and was down 1.1 percent at $1,185. U.S. gold futures for June delivery settled $15.40 lower at $1,85.30 an ounce. Any hike by the Fed, which has kept rates near zero since 2008 to stimulate the U.S. economy, could further reduce demand for assets perceived as safer such as gold. A stronger dollar also makes gold more expensive for holders of other currencies and typically erodes its appeal.
(Daily chart / 4 hourly chart below)
Gold March 31 at 00:45 GMT 1186.1 H: 1199.9 L: 1182.4
Gold Technical
| S3 | S2 | S1 | R1 | R2 | R3 |
| 1150 | — | — | 1200 | 1240 | 1300 |
During the early hours of the Asian trading session on Tuesday, Gold is trading in a narrow range right below $1190 after falling sharply from the key $1200 resistance level. Current range: trading right above $1185.
Further levels in both directions:
• Below: 1150.
• Above: 1200, 1240 and 1300.
OANDA’s Open Position Ratios
![]()
(Shows the ratio of long vs. short positions held for Gold among all OANDA clients. The left percentage (blue) shows long positions; the right percentage (orange) shows short positions.)
The long position ratio for Gold has moved back towards 65% as it eased lower below the key $1200 level. The trader sentiment is in favour of long positions.
Economic Releases
- 23:30 (Mon) AU AIG Manufacturing PMI (Mar)
- 01:30 AU Private Sector Credit (Feb)
- 05:00 JP Construction orders (Feb)
- 05:00 JP Housing starts (Feb)
- 08:30 UK Current Account (Q4)
- 08:30 UK GDP (3rd Est.) (Q4)
- 08:30 UK Index of Services (Jan)
- 09:00 EU Flash HICP (Mar)
- 09:00 EU Unemployment (Feb)
- 12:30 CA GDP (Jan)
- 13:00 US S&P Case-Shiller Home Price (Jan)
- 13:45 US Core PCE Price Index (Feb)
- 14:00 US Consumer Confidence (Mar)


