Today’s AM fix was USD 1,254.00, EUR 921.04 and GBP 749.33 per ounce.
Yesterday’s AM fix was USD 1,254.00, EUR 921.04 and GBP 749.82 per ounce.
Goldfell $2.85 or 0.2% yesterday to $1,255.29/oz. Silver slipped 0.03 cents or 0.2% to $18.99/oz.
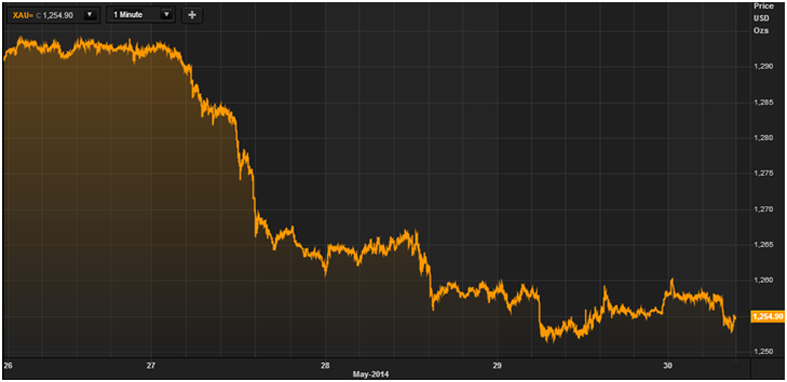
Gold suffered its fourth straight losing session yesterday leading to a 4% fall for the week.

Gold in US Dollars – 1 Minute, 5 Days – (Thomson Reuters)
Gold bullion in Singapore traded sideways around the $1,258/oz level prior to a bout of concentrated selling at the open in London (0800 BST) saw gold quickly fall from $1,257/oz to $1,253/oz.
The move lower this week would appear to be technically driven as there was no negative headline data, obvious reasons for price falls or indeed evidence of physical gold selling. Indeed, the mood music for gold is quite positive – especially the worsening situation in Ukraine and attendant geopolitical risk.
One plausible factor for gold’s weakness is the ever increasing, “irrationally exuberant” appetite for risk globally which may be impacting gold. Last week, the poor U.S. GDP number, which was much worse than analysts had forecast, did not lead to the bounce in gold that one would have expected. Nor did it lead to weakness in permanently levitating stock markets which continued on their merry way higher.
The simplistic view that the U.S. economy’s poor performance in the first quarter is purely weather related remains prevalent. This is despite increasing evidence that the U.S. consumer is struggling and close to being tapped out. The latter scenario is likely the case which will prove bullish for gold in the long term.
Gold premiums in India almost halved this week on the belief the new government will ease restrictions on imports of the precious metal thereby increasing demand. Indian premiums fell to $30-$40 an ounce over the global benchmark, from $80-$90 last week, dealers told Reuters.
In China, gold premiums ticked slightly higher this week but remain at around $3 per ounce. Chinese premiums have remained depressed this week, which suggests demand in China has not yet picked up on this week’s price weakness.
Special Notice Regarding Reduction In Premiums: Gold Bars Reduced To 1.6% Premium - Click Here
Technically, gold is vulnerable to a further fall to test what appears to be a double bottom between $1,180/oz and $1,200/oz. This is particularly the case in the very short term, in other words, by early next week.
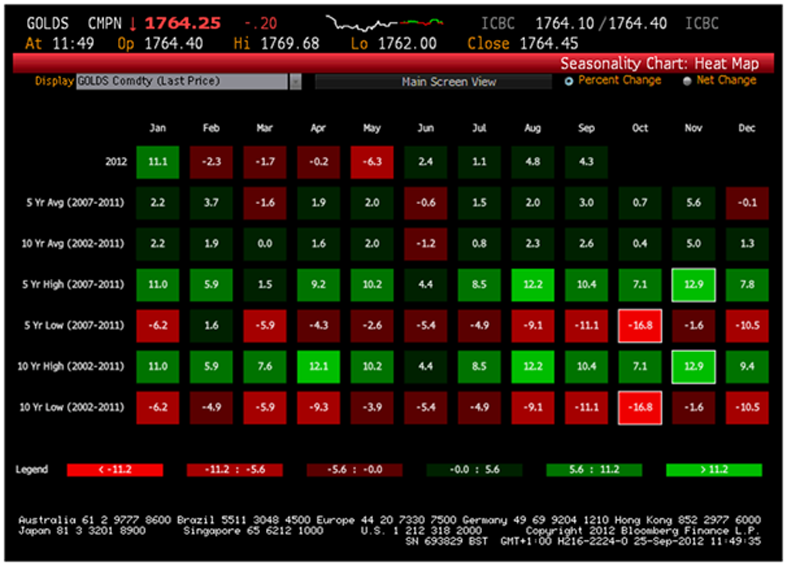
It is worth considering seasonal trends and June is traditionally one of the weakest months for gold (see heatmap). Gold’s 5 year and 10 year average performance in June is negative.

Gold Seasonality Chart – Heatmap (Bloomberg)
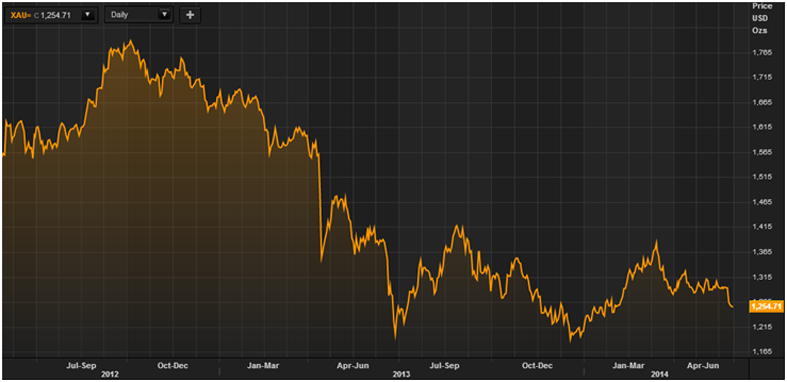
It is also worth considering last year’s performance. Gold saw massive concentrated selling in April and further weakness in May – from $1,476/oz to $1,386/oz. Then June saw gold fall again, from $1,386/oz to the $1,200/oz level at the end of June which marked the end of the 2nd quarter, 2013.
This is a time when traders, investors and the media take stock and evaluate the relative performance of various assets. If one were attempting to paint the tape through price manipulation, one would aim to have gold lower at mid year and year end. This is exactly what happened.
This had the effect of greatly reducing “animal spirits” in the gold market and snuffing out the potential for rallies given the very significant global demand that was occurring, especially in China.
Gold then bounced sharply in July and August prior to giving up some of those gains in September, trading sideways in October and then trading lower in November and December prior to the what appears to be the second bottom – exactly at year end 2013 (see chart below).

Gold in U.S. Dollars, Daily, 2 Year – (Thomson Reuters)
Momentum is a powerful force and the short term trend is down and therefore further weakness in the coming days and in June is quite possible.
However, gold’s 14-day relative-strength index fell to 31.2 yesterday. The RSI is an important tool in a traders arsenal. These are the lowest levels since December and being near the 30 level indicates we are due a bounce soon.
Gold frequently sees weakness and bottoms soon after options expiration which took place Tuesday. Also, $1,200 should remain support as the $1,200 level is the average cost to produce an ounce of gold globally.
The fundamentals are continuing and heightened geopolitical risk and robust global demand as seen in the recent World Gold Council data. Chinese demand has fallen somewhat in recent weeks but there is now the possibility of the return of Indian gold demand with the newly elected Modi government in India.
While gold is vulnerable technically to further weakness, its fundamentals remain sound. Some of the important gold related stories and developments this week which could yet propel gold higher include Putin’s declaration that Russia and China need to secure their gold and foreign exchange reserves and China’s plans to launch a physical ‘Global Gold Exchange’.
Overnight, ANZ Bank (ASX:ANZ) confirmed the story that it is seeking participation in the new international gold exchange in Shanghai. ANZ China CEO was quoted in the Wall Street Journal as saying “we are very keen to play a role in such a setup.”
Currency wars are heating up again and some of the key developments in recent days and weeks are gold bullish.
In recent weeks, Russia dumped a record amount of US treasuries and Russia’s central bank buys 28 metric tonnes of gold worth $1.4 billion in April alone. Last week, Russia and China announced a landmark economic agreement which includes a natural gas deal worth $400 billion and increasing use of their own currencies in bilateral trade.
Last week, Putin said Russia and China need to secure their gold and currency reserves and Russia set up the Eurasian Economic Union with Belarus and Kazakhstan. Armenia are to join within a month and Kyrgyzstan within a year.
This comes against a backdrop of China openly calling for a de-Americanization of the world in recent months and China, Russia, Iran and 21 other countries signing an agreement bolstering cooperation to promote peace, security and stability in Asia.
China is buying natural resources and hard assets globally and investing in infrastructure in Africa and West Asia in order to extract these natural resources. China is importing unprecedented amounts of physical gold and senior Chinese policy makers and officials have gone on record regarding how they view gold as in important strategic and monetary asset.
Thus, while gold is vulnerable to weakness in the short term, the smart money is again accumulating and will use this latest bout of selling to acquire gold at what will in time be seen as bargain prices.
All fiat currencies including the dollar, euro and pound are vulnerable to devaluations. As one astute commentator said on Twitter this week, being able to acquire cheaper gold given the state of the world today is “like being given discounts on life-rafts on the Titanic …”