Get 40% Off
🚨 Volatile Markets? Find Hidden Gems for Serious OutperformanceFind Stocks Now

Gold Struggling To Break Away Once Again

Published 06/20/2016, 03:37 AM
Updated 07/09/2023, 06:31 AM

Gold Daily Chart

As we prepare for a volatile week, with every catastrophic world event being laid at the door of the UK and Brexit, it’s time to consider gold which is likely to see some volatile price action this week.

If we start with the daily chart, Thursday’s price action was both dramatic and demonstrable as gold moved in a $40 per ounce range, before finally settling back at the mid point of the session with a long legged doji candle.

With the price action also accompanied by ultra high volume, one thing was clearly evident: this was indecision on a grand scale, and brought the recent rally for gold to a shuddering halt once more.

The $100 per ounce range defined by the ceiling at $1300 per ounce and the floor at $1200 per ounce continues to contain the precious metal. Until one of those levels is breached we are likely to see further sideways price in this range.

Indeed Friday’s price action once again tested this level for the August contract with the high of $1302.70 failing to hold. As a result, the market closed back below this level to end the week at $1294.80 per ounce.
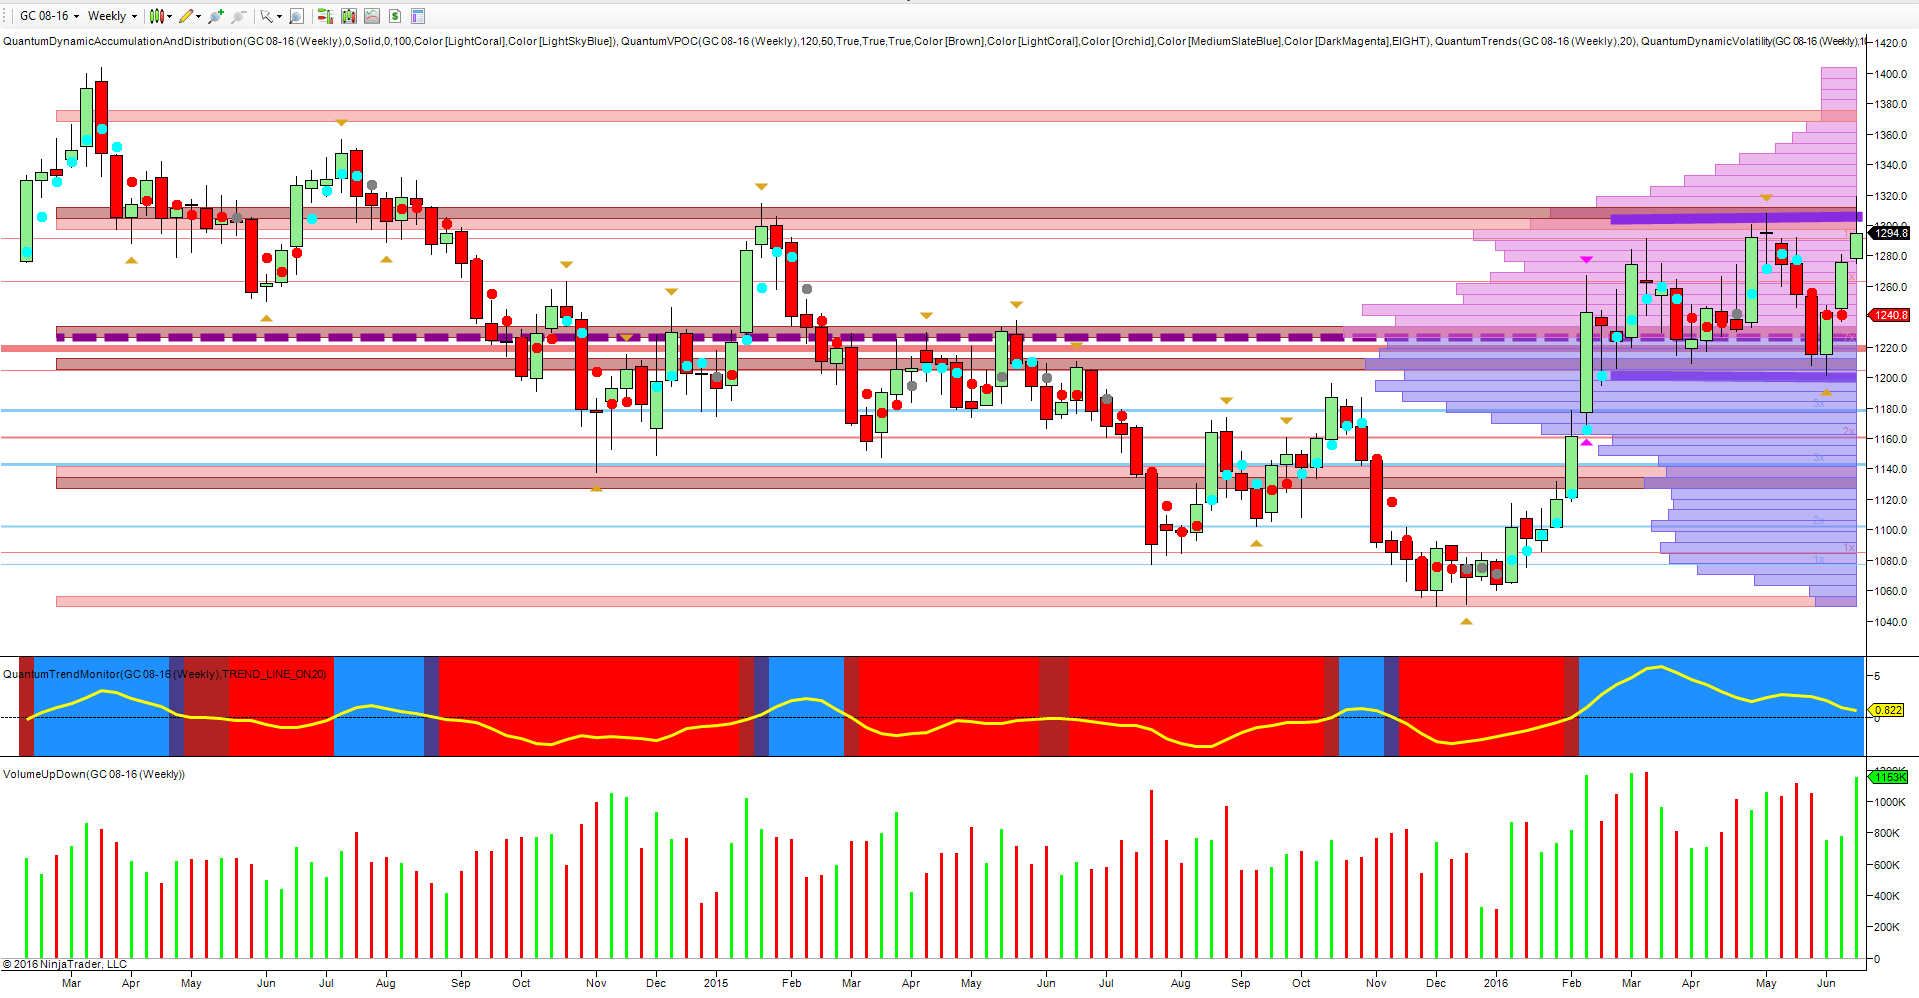
Gold Weekly Chart

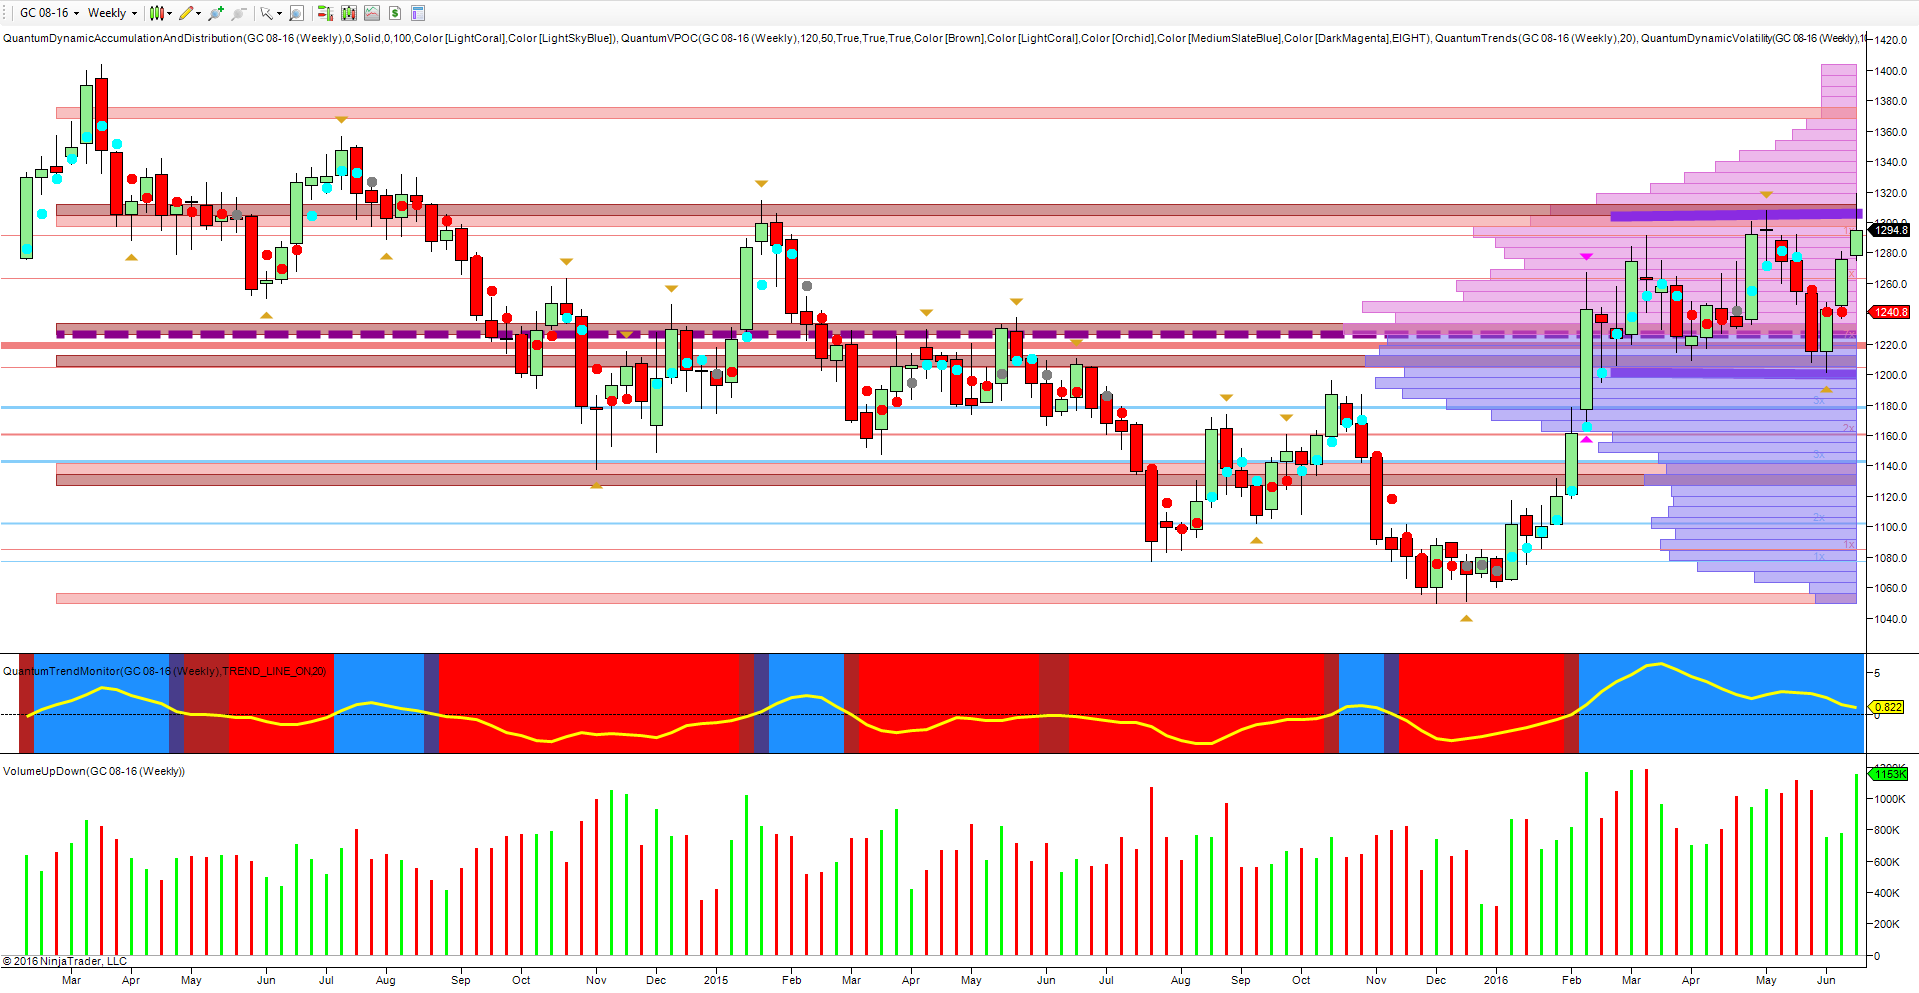
Moving to the weekly chart, last week’s price action could best be described as weak with the deep wick to the upper body of the candle and high volume signalling selling pressure building and a potential reversal in due course.
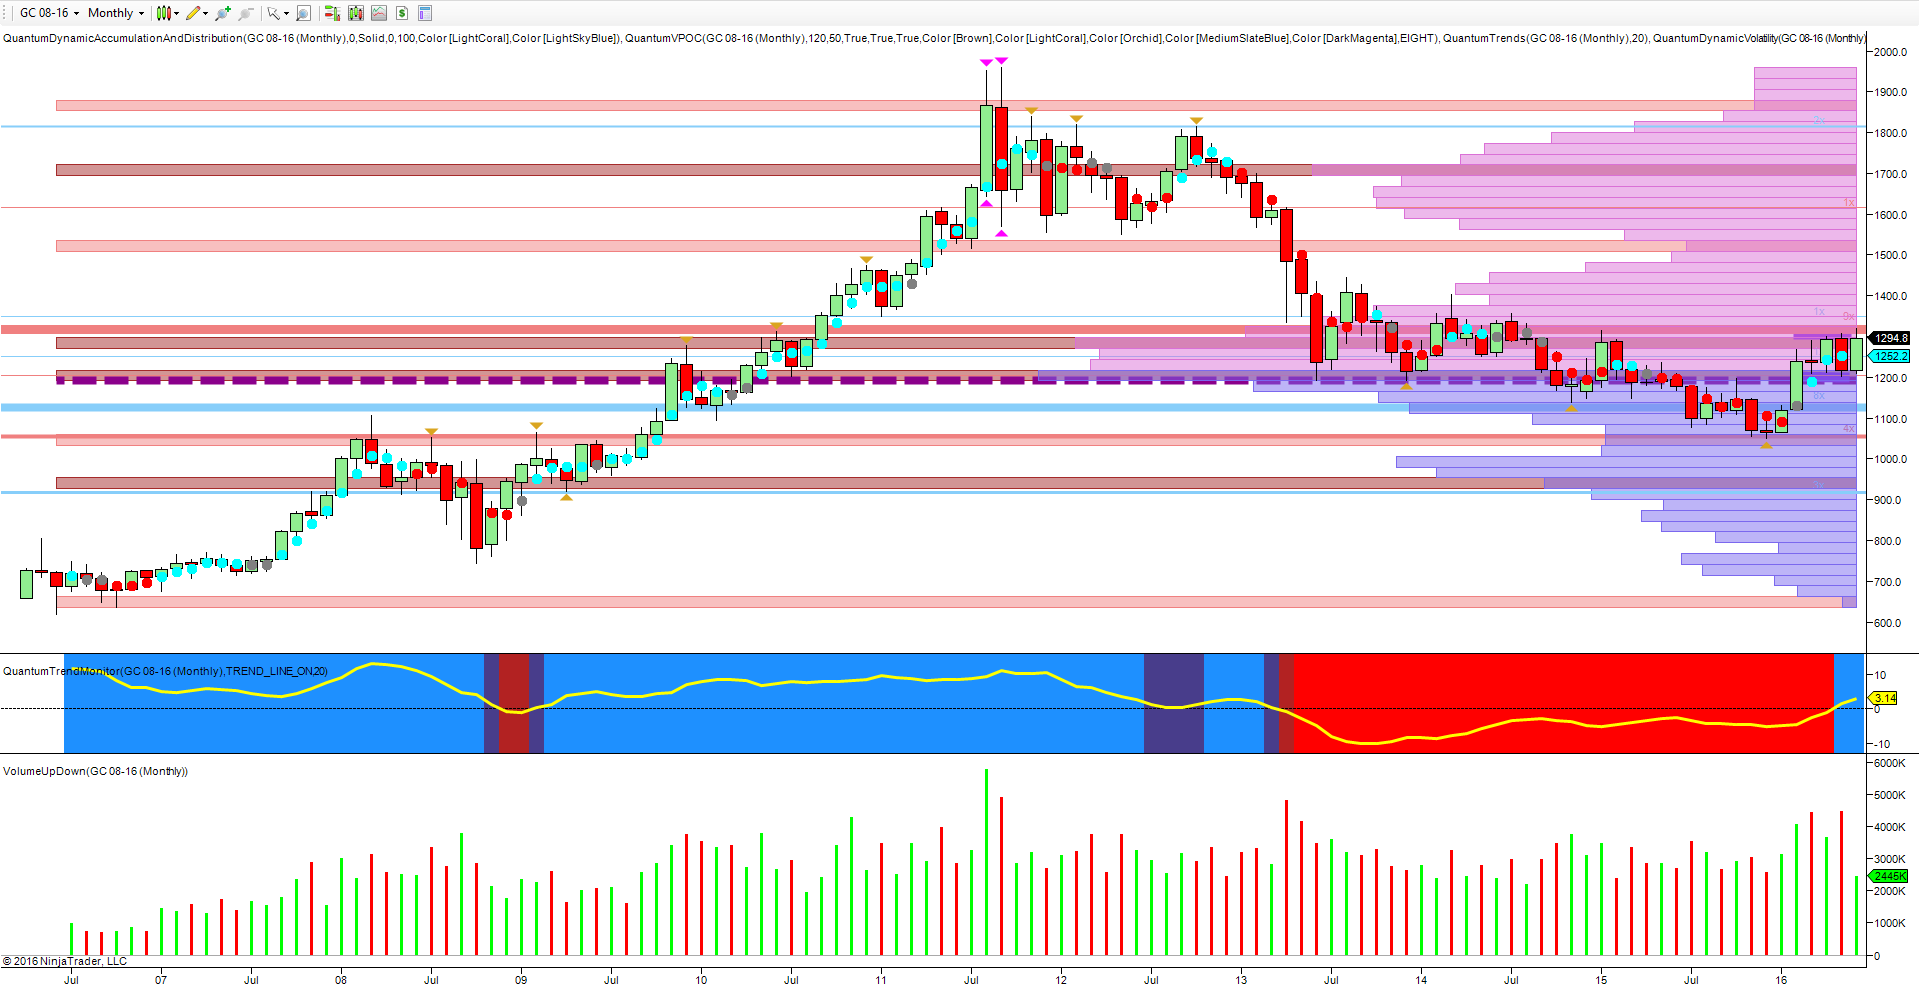
Gold Monthly Chart

Finally to the monthly chart which reminds us once again that the progress for gold higher is stilted to say the least as we continue to test the deep resistance area in the $1300 per ounce area. Given the density of price action awaiting in this region, this is no great surprise.

3rd party Ad. Not an offer or recommendation by Investing.com. See disclosure here or remove ads .

Indeed this is also confirmed with the volume point of control which remains in the $1200 per ounce region. The high volume nodes at $1295 per ounce and above add further downwards pressure.

Latest comments

Risk Disclosure: Trading in financial instruments and/or cryptocurrencies involves high risks including the risk of losing some, or all, of your investment amount, and may not be suitable for all investors. Prices of cryptocurrencies are extremely volatile and may be affected by external factors such as financial, regulatory or political events. Trading on margin increases the financial risks.
Before deciding to trade in financial instrument or cryptocurrencies you should be fully informed of the risks and costs associated with trading the financial markets, carefully consider your investment objectives, level of experience, and risk appetite, and seek professional advice where needed.
Fusion Media would like to remind you that the data contained in this website is not necessarily real-time nor accurate. The data and prices on the website are not necessarily provided by any market or exchange, but may be provided by market makers, and so prices may not be accurate and may differ from the actual price at any given market, meaning prices are indicative and not appropriate for trading purposes. Fusion Media and any provider of the data contained in this website will not accept liability for any loss or damage as a result of your trading, or your reliance on the information contained within this website.
It is prohibited to use, store, reproduce, display, modify, transmit or distribute the data contained in this website without the explicit prior written permission of Fusion Media and/or the data provider. All intellectual property rights are reserved by the providers and/or the exchange providing the data contained in this website.
Fusion Media may be compensated by the advertisers that appear on the website, based on your interaction with the advertisements or advertisers.
© 2007-2024 - Fusion Media Limited. All Rights Reserved.