Talking Points:
- US Dollar Rebound Capped at Trend Line Resistance Barrier
- S&P 500 Waiting for Direction Cues Within Familiar Range
- Crude Oil in Digestion Mode, Gold Nears Top Confirmation
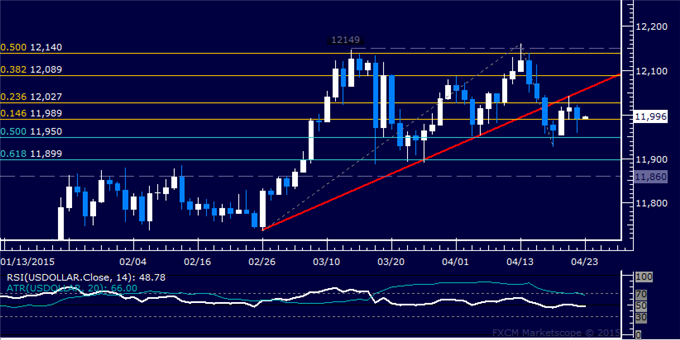
US DOLLAR TECHNICAL ANALYSIS – Prices transitioned into digestion mode after bouncing to retest a recently broken rising trend. A daily close above the 23.6% Fibonacci expansion at 12027 exposes the trend line support-turned-resistance at 12058. Alternatively, a move below the 14.6% expansion at 11989 opens the door for a challenge of the 50% Fib retracement at 11950.retracement at 11950.
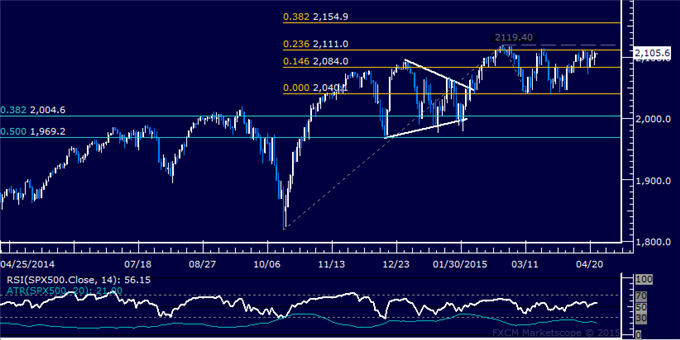
S&P 500 TECHNICAL ANALYSIS – Prices continue to hover below resistance in the 2111.00-19.40 area (23.6% Fibonacci expansion, February 25 high). A break above that on a daily closing basis exposing the 38.2% level at 2154.90. Alternatively, a reversal below the 14.6% Fib at 2084.00 targets the March 12 low at 2040.10.
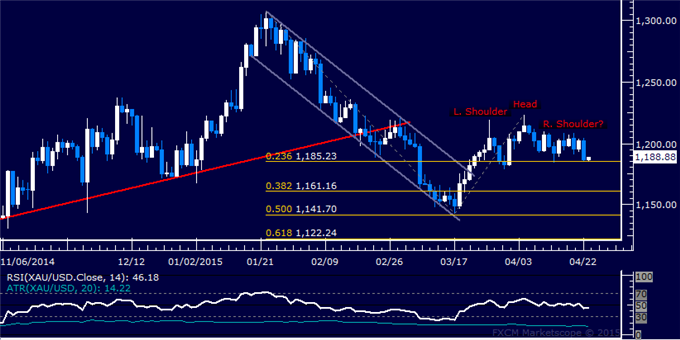
GOLD TECHNICAL ANALYSIS – Prices may be carving out a bearish Head and Shoulders top chart pattern. Confirmation is required on a daily close below 1185.23, the 23.6% Fibonacci expansion, with the first downside target thereafter coming in the 38.2% level (1161.16). Near-term resistance is at 1224.15, the April 6 high.
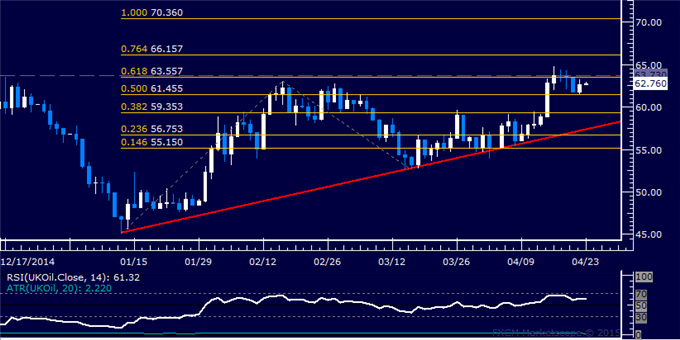
CRUDE OIL TECHNICAL ANALYSIS – Prices transitioned back into consolidation mode after recoiling lower from resistance near the $65/barrel figure. A break below the 50% Fibonacci expansion at 61.46 exposes the 38.2% level at 59.35. Alternatively, a move above the 63.56-73 area (61.8% Fib, April 16 close) targets the 76.4% expansion at 66.16.