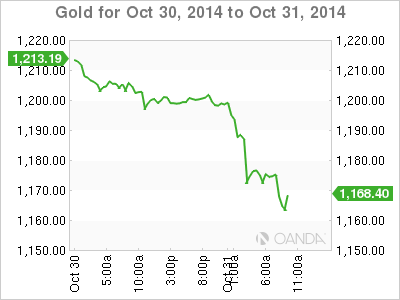
Gold prices continue to lose ground on Friday, as the spot price trades at $1174.86 per ounce in the European session. Gold has slipped to its lowest level since 2014, and has tumbled 4.4% since Tuesday. Will the dollar rally continue? On the release front, today’s highlight is Revised UoM Consumer Sentiment. The markets are expecting the indicator’s upward trend to continue, with the estimate standing at 86.4 points.
It was another solid performance from US GDP, which posted a strong gain of 3.5% in Q3, ahead of the estimate of 3.1%. Although this was short of the Q2 reading of 4.0%, the two readings mark the strongest six-month gain we’ve seen in ten years. Unemployment Claims increased slightly to 287 thousand, slightly higher than the previous reading of 284 thousand. However, the four-week average remains at multi-year lows, pointing to an improving labor market.
The US dollar gained about 100 points on Wednesday, boosted by a hawkish Fed policy statement. The Fed said that the labor market is strengthening and inflation remains on target, although it did note that the labor market participation rate remains low. As expected the Fed completed the taper of its QE3 program. The asset-purchase program was initially started in 2008, at the height of the economic crisis, in order to boost a weak US economy. The termination of the QE is a symbolic step which is a vote of confidence from the powerful Fed that the US economy is on the right track.

XAU/USD October 31 at 10:10 GMT
- XAU/USD 1174.86 H: 1202.71 L: 1167.06
XAU/USD Technicals
| S3 | S2 | S1 | R1 | R2 | R3 |
| 1111 | 1130 | 1156 | 1200 | 1215 | 1240 |
- Gold lost ground late in the Asian session and continues to weaken in European trading.
- 1200 has switched to a resistance role as gold trades as gold trades at lower levels. 1215 is next.
- On the downside, 1156 is under pressure. Will the pair break below this level?
- Current range: 1156 to 1200.
Further levels in both directions:
- Below: 1156, 1130, 1111 and 1073
- Above: 1200, 1215, 1240, 1252 and 1275
OANDA’s Open Positions Ratio
XAU/USD ratio is pointing to gains in short positions on Friday, reversing the direction seen a day earlier. This is consistent with the pair, as gold continues to post losses. The ratio has a majority of long positions, indicative of trader bias in favor of gold reversing ground and moving higher.
XAU/USD Fundamentals
- 12:30 US Core CPI Price Index. Estimate 0.1%.
- 12:30 US Employment Cost Index. Estimate 0.6%.
- 12:30 US Personal Spending. Estimate 0.2%.
- 12:30 US Personal Income. Estimate 0.3%.
- 13:45 US Chicago PMI. Estimate 60.2 points.
- 13:55 US Revised UoM Consumer Sentiment. Estimate 86.4 points.
- 13:55 US Revised UoM Inflation Expectations.
