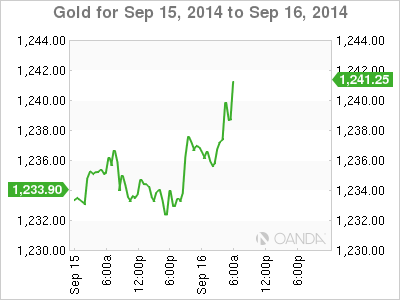
Gold prices have edged higher on Tuesday, as the metal tries to bounce back from last week's sharp fall. In the European session, the spot price stands at $1239.11 per ounce. The US dollar ran roughshod over gold last week, posting gains of about 3%. In the US, today's highlight is the Producer Price Index, the first major US event of the week. The markets are expecting a small gain of 0.1%, which would be unchanged from the previous reading.
US numbers wrapped up last week on a high note. Core Retail Sales improved to 0.3%, edging above the estimate of 0.2%. Retail Sales posted a nice gain of 0.6%, well above the estimate of 0.3%. There was excellent news from the UoM Consumer Sentiment, which bounced back from a weak reading in July and improved to 84.6 points, its best showing since November 2012. The forecast stood at 83.2 points. These indicators point to an increase in consumer confidence and spending, which underscore a deepening economic recovery.
US job numbers continue to be source of concern. Unemployment Claims rose to 315 thousand, the largest number of claims in 10 weeks. The reading was much higher than the estimate of 306 thousand. This follows soft numbers from JOLTS Job Openings and a dismal Nonfarm Payrolls last week. The troubling job numbers are unlikely to affect the Fed's plan to continue trimming QE later this week, but a soft labor market could postpone plans to raise interest rates by mid-2015.
Scottish voters will cast their ballots in a referendum on independence on Thursday. The most recent polls are pointing to a close vote, with many voters still undecided. If voters do choose to secede from the UK, this would create plenty of questions and uncertainty, including what currency an independent Scotland would use and how the national debt would be divided. A vote to split up the UK could lead to turmoil in the markets and bolster gold, a traditional safe-haven in times of uncertainty. Traders should treat the referendum as a market-mover.

XAU/USD September 16 at 10:55 GMT
XAU/USD 1239.11 H: 1242.02 L:1232.40
XAU/USD Technical
| S3 | S2 | S1 | R1 | R2 | R3 |
| 1156 | 1186 | 1210 | 1240 | 1252 | 1275 |
- XAU/USD edged higher in the Asian session and again early in the European session.
- 1210 is an immediate support line. 1186 is stronger.
- On the upside, 1240 is under strong pressure and could break during the day. 1252 is next.
- Current range: 1210 to 1240.
Further levels in both directions:
- Below: 1210, 1186, 1156 and 1111
- Above: 1240, 1252, 1275, 1300, and 1315
OANDA's Open Positions Ratio
XAU/USD ratio is almost unchanged on Tuesday. This is not consistent with the movement we're seeing from the pair, as gold has posted small gains. The ratio has a substantial majority of long positions, indicative of trader bias towards gold continuing to gain ground against the dollar.
XAU/USD Fundamentals
- 12:30 US PPI. Estimate 0.1%.
- 12:30 US Core CPI. Estimate 0.1%.
- 13:00 US TIC Long-Term Purchases. Estimate 24.3B.
