Gold received bids above key resistance levels following the retreat in US equities over the last two days. With growing concern, equity markets across Europe, the Middle East, and Asia sell-off. The Shanghai Composite declined over five percent last night, the worst one-day move since 2009; the Nikkei 225 craters 700 points as the yen strengthens causing the USD/JPY to fall over 250 pips before rebounding off of 118; the Athens Stock Exchange falls over 11 percent today as the three-year yield on Greek debt matches the 10-year around seven percent. The US markets continue the sanguine session.
The US Dollar weakens almost one percent on growing uncertainty following worldwide equity sell-offs. The weaker dollar is allowing crude to rebound from below $63 per barrel, but spreads on energy debt have ballooned to 880 bps, an all-time new high as traders deem the high-yielding debt extremely risky. The VIX spikes over 16, creating the worst two-day span in over two months on potential hedging on credit positions. The movement in the “fear” indicator correlate to high-yield debt spreads widening.
Safe havens, like the yen and US 10-year, see action amid growing concern. The Japanese yen gained over 1.25 percent, and the US 10-year yield fell below 2.20 percent. The precious metals complex were big winners following the non-farms payroll anomaly on Friday. Gold, up over three percent, reaching $1,239 per toz. before seeing some profit taking. Silver seen a rare surge higher, up over five percent to $17.12 per toz. When in doubt, gold sees support – as it always has.
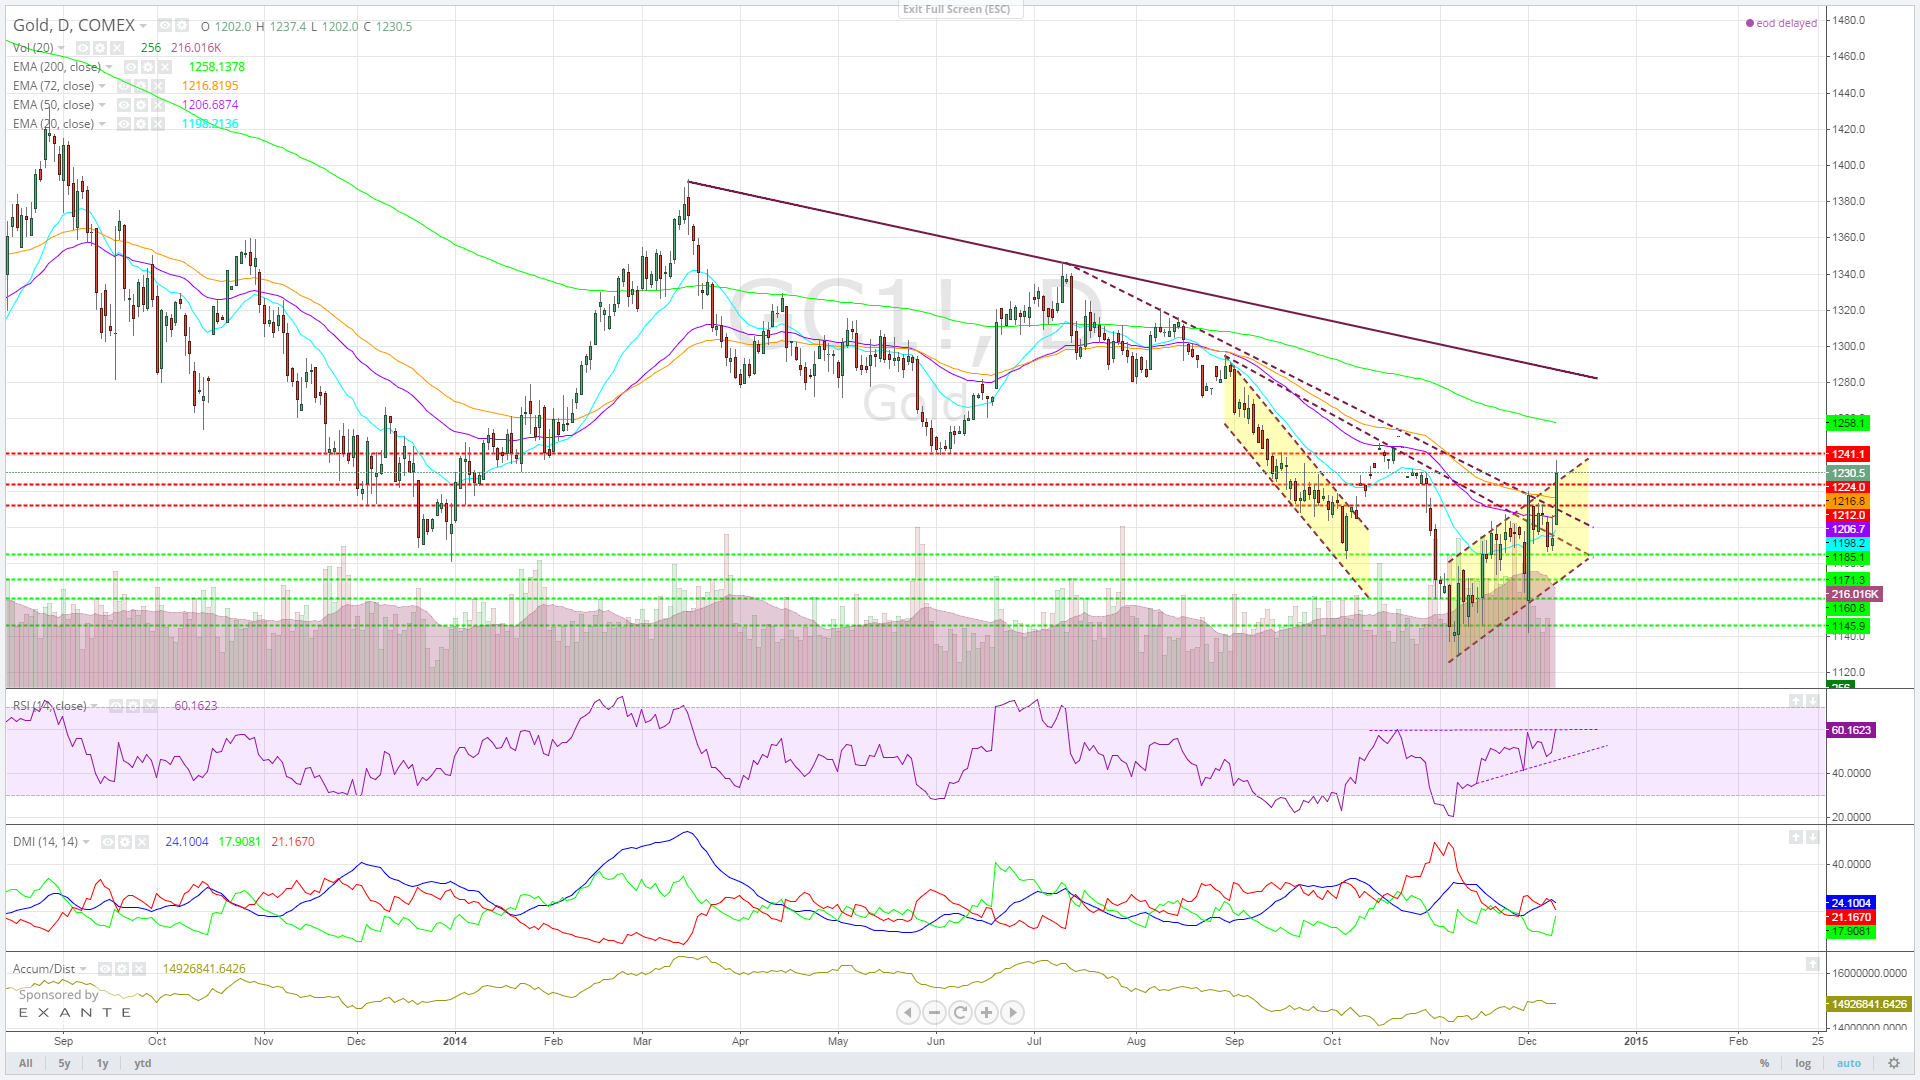
Gold, technically, is looking strong. Bouncing nearly $100 per toz. since the $1,140 low of November 30, price action has broken out of the major ascending channel. Key resistance levels of $1,212 and $1,224 look to have been turned into support. The next level of resistance could be a hard nut to crack, but the growing global concern over demand and growth could allow gold to close above $1,240. A close above this level will give gold the opportunity to test the 200-day EMA, a level not tested since August. Price action will likely grind higher into year’s end because the majority of equity investors still remain highly – almost ignorantly – bullish.
The directional movement indicator (DMI) is showing the + DMI ticking upward, signaling bullishness within the price action. A bullish convergence (sending the – DMI below the + DMI) will help gold’s march higher.
There is a continuation of degradation within market internals, and it is shaping up to be another 2007/8. Regardless of the equity markets’ inherent ability to loose 50 percent of it’s value every five-to-six years, investors will need to be increasingly nimble. The easy money has been made, and the fundamental hate for gold and silver will turn into utter confusion as the “premier currency” continues to remain supported.
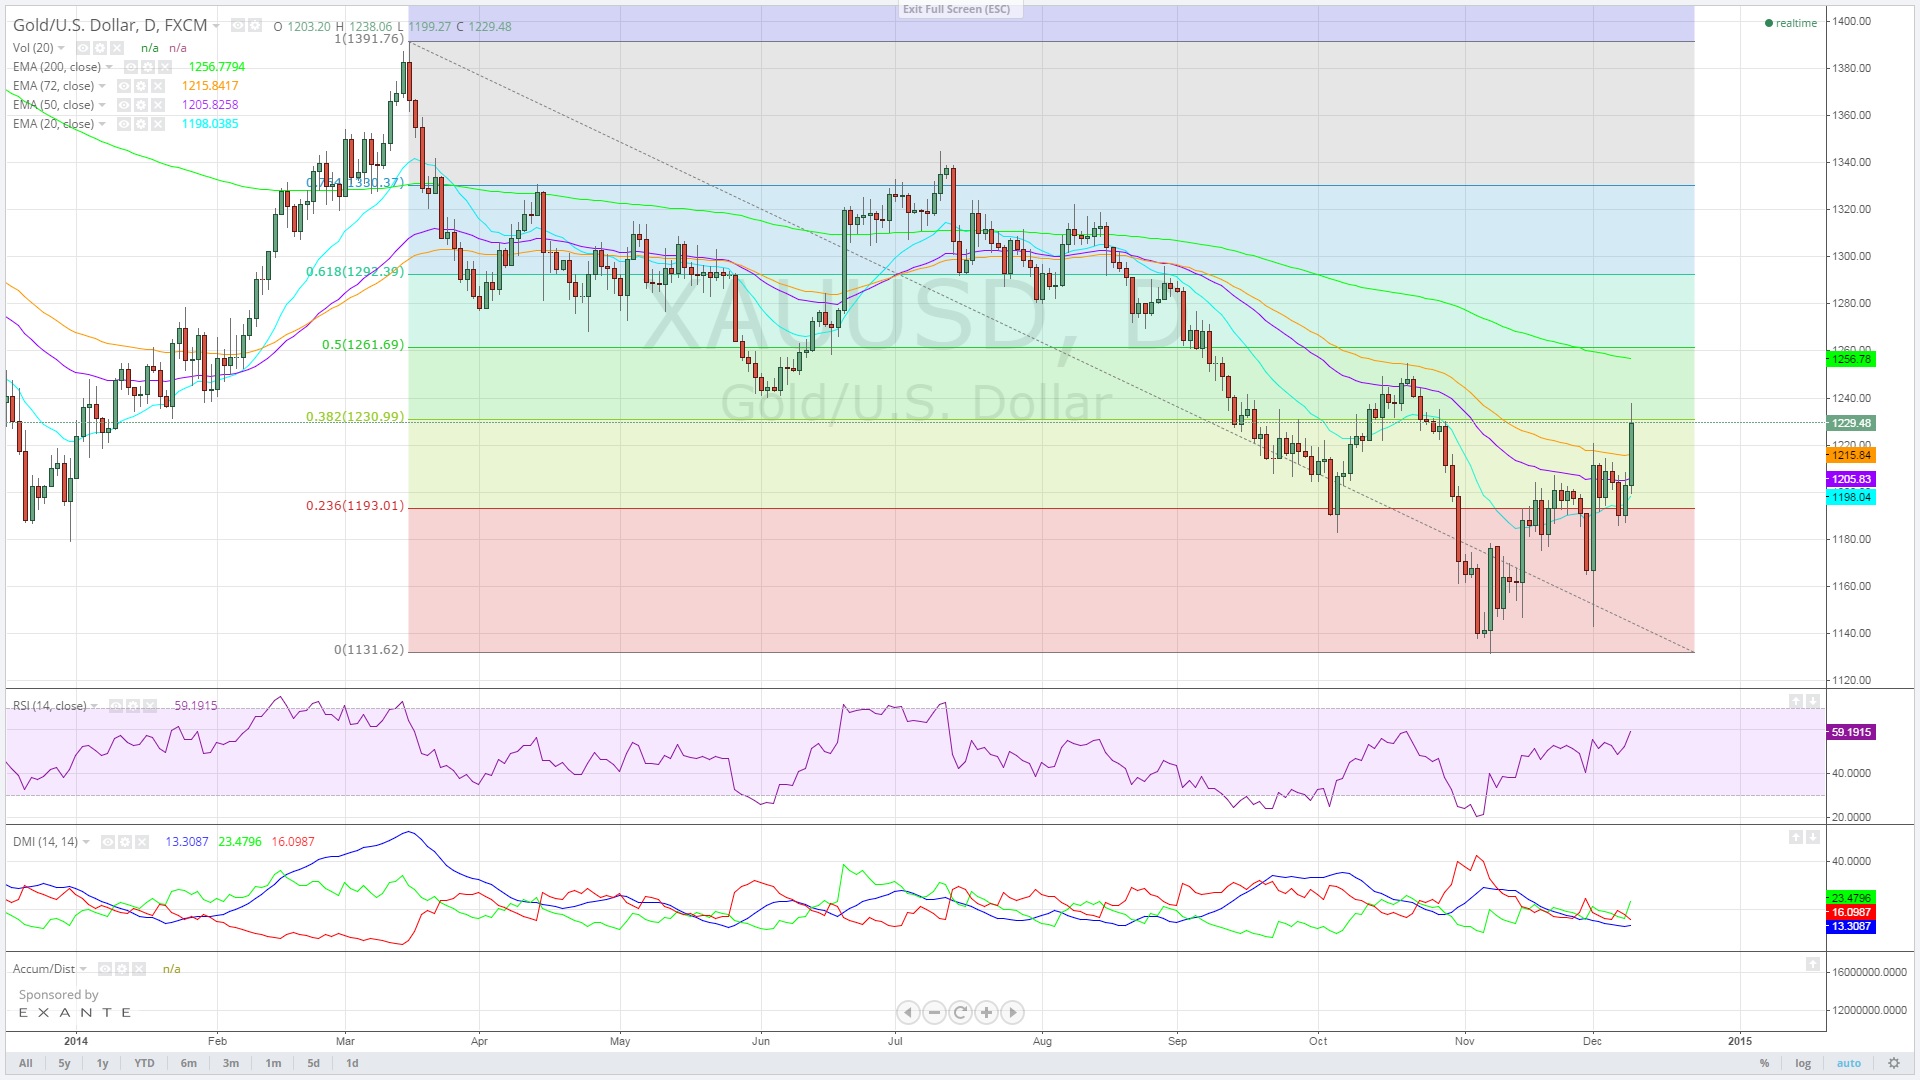
Intraday, gold looks to have seen some minor resistance on the 4H chart at the 38.2 percent Fibonacci retracement level from the yearly high-to-low. However, both the RSI and DMI indicate room for increasing bullishness. Expect minor pullback on profit taking before the next leg higher.
Original Post...
- English (UK)
- English (India)
- English (Canada)
- English (Australia)
- English (South Africa)
- English (Philippines)
- English (Nigeria)
- Deutsch
- Español (España)
- Español (México)
- Français
- Italiano
- Nederlands
- Português (Portugal)
- Polski
- Português (Brasil)
- Русский
- Türkçe
- العربية
- Ελληνικά
- Svenska
- Suomi
- עברית
- 日本語
- 한국어
- 简体中文
- 繁體中文
- Bahasa Indonesia
- Bahasa Melayu
- ไทย
- Tiếng Việt
- हिंदी
Gold Sees Major Bids Amid Growing Global Concern
Published 12/09/2014, 12:43 PM
Updated 07/09/2023, 06:31 AM
Gold Sees Major Bids Amid Growing Global Concern
3rd party Ad. Not an offer or recommendation by Investing.com. See disclosure here or
remove ads
.
Latest comments
Install Our App
Risk Disclosure: Trading in financial instruments and/or cryptocurrencies involves high risks including the risk of losing some, or all, of your investment amount, and may not be suitable for all investors. Prices of cryptocurrencies are extremely volatile and may be affected by external factors such as financial, regulatory or political events. Trading on margin increases the financial risks.
Before deciding to trade in financial instrument or cryptocurrencies you should be fully informed of the risks and costs associated with trading the financial markets, carefully consider your investment objectives, level of experience, and risk appetite, and seek professional advice where needed.
Fusion Media would like to remind you that the data contained in this website is not necessarily real-time nor accurate. The data and prices on the website are not necessarily provided by any market or exchange, but may be provided by market makers, and so prices may not be accurate and may differ from the actual price at any given market, meaning prices are indicative and not appropriate for trading purposes. Fusion Media and any provider of the data contained in this website will not accept liability for any loss or damage as a result of your trading, or your reliance on the information contained within this website.
It is prohibited to use, store, reproduce, display, modify, transmit or distribute the data contained in this website without the explicit prior written permission of Fusion Media and/or the data provider. All intellectual property rights are reserved by the providers and/or the exchange providing the data contained in this website.
Fusion Media may be compensated by the advertisers that appear on the website, based on your interaction with the advertisements or advertisers.
© 2007-2024 - Fusion Media Limited. All Rights Reserved.
