As the great aircraft of the world hurtle down the tarmac toward takeoff, cockpit crews are attendant to an acute speed and remaining runway distance calculation known as "V1", that final moment to decide between going wheels up or safely aborting with enough runway to spare.
Gold right now is at its own "V1". As you'll herein see, Gold has maintained upside momentum in moneyflow as we showed a week ago, price has gained consistency in its linear regression uptrend, and on a weekly basis, is poised to break up through and end the declining parabolic Short trend. However, with specific respect to being at "V1", Gold is right up against a critical downtrend line. Naturally, if trendlines always contained price, markets would eventually travel nowhere. And presently for Gold, our other quantitative and technical measures are positioned for wheels up. The time is nigh to add on some fundamental push borne of an expanding awareness in maintaining one's worth given the dependent dash for dough. For complacency is inevitably -- perhaps imminently -- ending:
When the dominoes fall, the financial rip shall be felt 'round the globe. What or who shall tip the first tile? There are so many imbalances from which to choose! Our favourite all along, of course, has been the properly positive correlation of Gold to the increase of fiat-created balance sheet money supplies, (in full acknowledgment that such relationship has suffered over the last two years). So as a refresher for everyone, (of whom those facile with The Gold Story been attentive for decades), vis-à-vis the growth in StateSide M2 alone, Gold has been behind the debasement curve and again uncannily reversing against it since 2011 when currency creation here, there and everywhere has been at its most rampant! To wit: 
As for the dominoes, the archetypal tile tipper would be the quintessential financial entity (i.e. your bank) with eroding asset values, the interest generation of which, especially in a low rate environment, and principal repayment of which shan't in real terms be covering expanding liabilities nor maintaining the true value of its net worth. The bank could accelerate repayment of that which it is owed, (per that oft unread bit buried in loan documentation), leading to "Oh snap, I suddenly need dough". The first domino is then tipped, the others falling in turn, and the great race to remain solvent will be well underway.
'Course, it remains to be seen who the first tippee shall be: your local bank? How about the People's Bank of China desiring some dough be returned from its US Treasuries investments? Or, what happens when our own Fed gets pressed into further pandemic currency creation to support new government programs instituted to keep oldsters from running out of retirement dough with 20 years still to go? What about hedge funds with enough margin to slam the S&P 500 futures "limit down" in the middle of the night so as to be positioned for the "Look Ma No Earnings" crash? You did perhaps read this past week of a warning from Goldman Sachs for at least a market "correction", their first itemized reason being the P/E ratio. Coincidence? You don't suppose they've been reading The Gold Update, do you? Or peeking at the website's "S&P 500: Valuation & Ranks" page? One never knows...
In any event, here we go with what has to be the most riveting set of positive Gold graphics we've assembled in a long time. In the spirit of Gold having arrived at "V1", let's start with an update of the moneyflow chart from a week ago. Now five trading days later, the pace of monetary inflow remains above normal. Should the blue moneyflow line move above the green horizontal line, we'd confirm the "momentum buy" as being in force: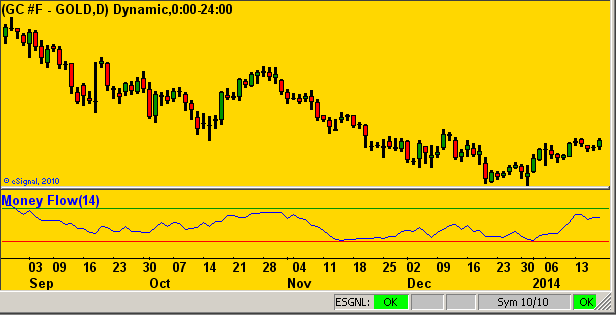
Next we go to uptrend consistency with this two panel view of Gold's Baby Blues. The left side displays the daily price bars for the last three months; should the blue dots rise above the +80% line, the 21-day linear regression uptrend will be confirmed as "consistent". The right side is simply the last 21 days with the diagonal trendline itself displayed for emphasis, (and for you slope aficionados out there, 'tis Gold's steepest up-gradient since the late August/early September period when price reached as high as 1434):
Now to our seminal staple: Gold's weekly bars, upon which we see the declining parabolic Short trend red dots about to be eclipsed by rising price. Gold for the fourth consecutive week has settled near if not on its weekly high. In fact, here's a stat you'll doubtful find elsewhere: the cumulative combined distance of Gold's last four weekly settles from each bar's highest price totals to just 10 points. The last time 'twas that tiny a margin? The week ending 20 April 2007, from which price rose 25% by that year's end. But to the salient point: should Gold trade up through 1263 -- just nine points from the current 1254 level -- at any time in the ensuing week, we'll see price above a first blue Long trend dot when we next meet: 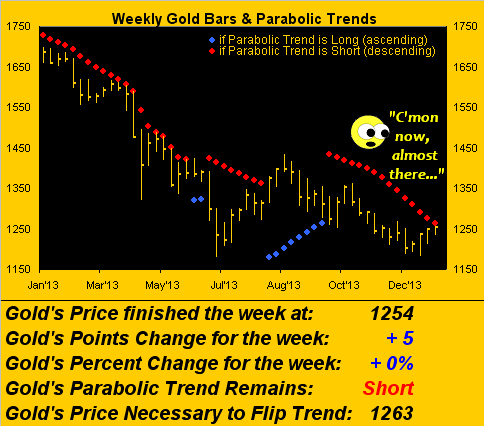
Oh how Gold has arrived at its "V1" indeed! Now for the critical part: to takeoff, or abort? Here we've Gold along with its smooth pearly valuation line, (a measure of price per Gold's movements vis-à-vis those of the markets that comprise BEGOS: Bond/Euro/Gold/Oil/S&P). This is the full view year-over-year, throughout which Gold's price decline has defied debasement and diminishing depository inventories. Per the oscillator (price less valuation) in the graphic's lower panel, Gold has rarely been "above value" (the zero line) for an entire year! And to moreover emphasize that Gold is at "V1", we've superimposed a critical downtrending purple line as a "wheels up or abort" determinant:
My vote is for wheels up accompanied by Andy Williams with "Fly me to the moon..."!
Indeed as in music, where 'tis said "the hits just keep on comin'", so too of late have higher support levels for Gold within its trading profile. You may recall two weeks ago that 1203 was visible support; then a week ago 1226 became fortification without even being since tested; and now support has up-shifted yet again to 1241 per the longest bar in the profile chart below, with 1226 still there as an underlying safety net:
What about Gold's recent relationship with the S&P? The following graphic is indicative of renewed negative correlation between Gold and the "crash-ready" stock market. Should the latter's negative correlation to Gold be maintained and the aforementioned Goldman be "correct" (pun!) then Gold shall proceed with takeoff:
As well it ought be, Squire. It does not take a huge swing in sentiment to send Gold aloft. As has been mentioned on occasion, the yellow metal resides -- at best these days -- in one form or another in just 5% of managed portfolios. A shift of that to 6% would well-leverage Gold to materially higher levels; a shift to10% would see it fly beyond the moon.
For at the end of the day, the Greatest Gold Positive remains ensuring that there is enough dough once the dominoes go. And they're upright, aligned, and in waiting to get the finger.
Finally, did you happen to catch this past week's release of the 2014 Index of Economic Freedom? As I reviewed the rankings, I saw that StateSide we've slipped out of the Top Ten to No. 12, (a testament to the success of our nation's three government branches' socio-Marxist bent). Yet I continued to anxiously scan down the list for a specific entry. At No. 70 I passed by France, (kudos to them for remaining in the Top 100). Still, I finally arrived at the end of the list, No. 178 rightly being North Korea, without spotting my target. But then when it comes to wee Monaco, being small is grand :)
And now as Gold passes through its "V1", the stage is set for a wheels up week. "Rotate and ascend!"
- English (UK)
- English (India)
- English (Canada)
- English (Australia)
- English (South Africa)
- English (Philippines)
- English (Nigeria)
- Deutsch
- Español (España)
- Español (México)
- Français
- Italiano
- Nederlands
- Português (Portugal)
- Polski
- Português (Brasil)
- Русский
- Türkçe
- العربية
- Ελληνικά
- Svenska
- Suomi
- עברית
- 日本語
- 한국어
- 简体中文
- 繁體中文
- Bahasa Indonesia
- Bahasa Melayu
- ไทย
- Tiếng Việt
- हिंदी
Gold Reaches 'V1' On The Runway: Will Upside Momentum Continue?
Published 01/20/2014, 01:40 AM
Updated 07/09/2023, 06:31 AM
Gold Reaches 'V1' On The Runway: Will Upside Momentum Continue?
Latest comments
Install Our App
Risk Disclosure: Trading in financial instruments and/or cryptocurrencies involves high risks including the risk of losing some, or all, of your investment amount, and may not be suitable for all investors. Prices of cryptocurrencies are extremely volatile and may be affected by external factors such as financial, regulatory or political events. Trading on margin increases the financial risks.
Before deciding to trade in financial instrument or cryptocurrencies you should be fully informed of the risks and costs associated with trading the financial markets, carefully consider your investment objectives, level of experience, and risk appetite, and seek professional advice where needed.
Fusion Media would like to remind you that the data contained in this website is not necessarily real-time nor accurate. The data and prices on the website are not necessarily provided by any market or exchange, but may be provided by market makers, and so prices may not be accurate and may differ from the actual price at any given market, meaning prices are indicative and not appropriate for trading purposes. Fusion Media and any provider of the data contained in this website will not accept liability for any loss or damage as a result of your trading, or your reliance on the information contained within this website.
It is prohibited to use, store, reproduce, display, modify, transmit or distribute the data contained in this website without the explicit prior written permission of Fusion Media and/or the data provider. All intellectual property rights are reserved by the providers and/or the exchange providing the data contained in this website.
Fusion Media may be compensated by the advertisers that appear on the website, based on your interaction with the advertisements or advertisers.
© 2007-2024 - Fusion Media Limited. All Rights Reserved.