Get 40% Off
⚠ Earnings Alert! Which stocks are poised to surge?
See the stocks on our ProPicks radar. These strategies gained 19.7% year-to-date.
Unlock full list

Gold Prices Facing Fibonacci Resistance?

Published 05/17/2015, 01:16 AM
Updated 07/09/2023, 06:31 AM

It has been more than a month since our last update on the gold market. In “Gold Bulls On The Losing Side Again?”, published on April 7th, we called a top at $1224, which was supposed to give a start to another sell-off. Indeed, the price of gold fell to $1170 on May 1st. However, we were expecting the decline to be much larger. The market did not think so. Yesterday, the yellow metal closed the week at $1225. Does this mean the bearish count has been invalidated? Should we turn bullish now? The chart below provides us with the answer.
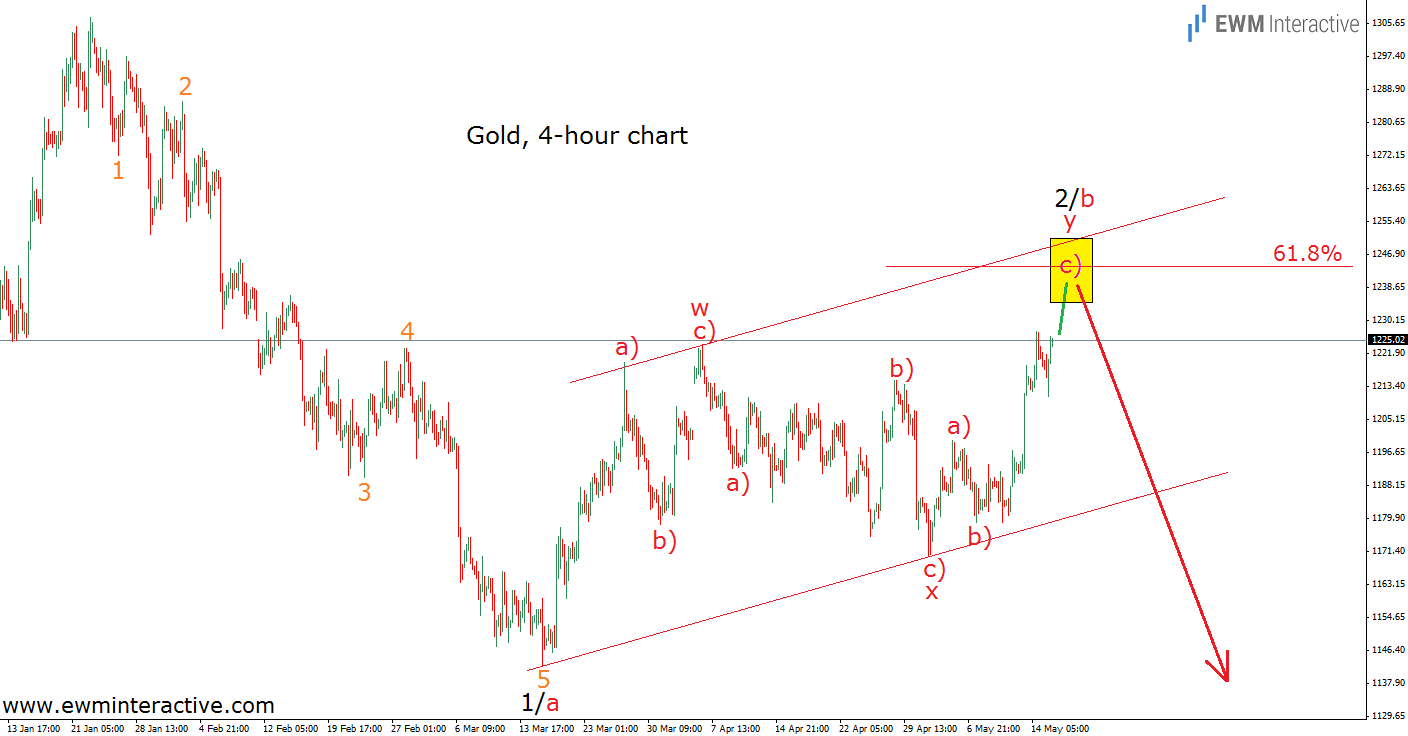

Gold 4 Hourly Chart

The April top marked the end of a simple a)-b)-c) zig-zag correction. It could have been the end of gold’s recovery, but the market thought it was too soon. That is why it decided to extend the simple zig-zag into what seems to be a double one. So, the slow and choppy price action between $1224 and $1170 is wave “x”. It connects the first zig-zag with the second one. Or, in other words, wave “w” with wave “y”. Now, there are two reasons we believe wave “y” is in its final stages. First, gold prices are approaching the upper line of the corrective channel.

Original post

Latest comments

Risk Disclosure: Trading in financial instruments and/or cryptocurrencies involves high risks including the risk of losing some, or all, of your investment amount, and may not be suitable for all investors. Prices of cryptocurrencies are extremely volatile and may be affected by external factors such as financial, regulatory or political events. Trading on margin increases the financial risks.
Before deciding to trade in financial instrument or cryptocurrencies you should be fully informed of the risks and costs associated with trading the financial markets, carefully consider your investment objectives, level of experience, and risk appetite, and seek professional advice where needed.
Fusion Media would like to remind you that the data contained in this website is not necessarily real-time nor accurate. The data and prices on the website are not necessarily provided by any market or exchange, but may be provided by market makers, and so prices may not be accurate and may differ from the actual price at any given market, meaning prices are indicative and not appropriate for trading purposes. Fusion Media and any provider of the data contained in this website will not accept liability for any loss or damage as a result of your trading, or your reliance on the information contained within this website.
It is prohibited to use, store, reproduce, display, modify, transmit or distribute the data contained in this website without the explicit prior written permission of Fusion Media and/or the data provider. All intellectual property rights are reserved by the providers and/or the exchange providing the data contained in this website.
Fusion Media may be compensated by the advertisers that appear on the website, based on your interaction with the advertisements or advertisers.
© 2007-2024 - Fusion Media Limited. All Rights Reserved.