2015's March Madness has well-exceeded the thrilling bounds of a bunch of talented youngsters running to and fro tossing basketballs, an annual StateSide event that captivates millions of us to the extent that seemingly hours of sports airtime are spent alone in fawning over the projected game outcomes by the President. But in assessing the balance of our Big Blue Ball, world events this March are running from sad to bad to mad. To the extent that Gold has been getting a bid from the fear of global instability is not accurately measurable, however, without enumerating them, we are witnessing a saddening intensification of events running the gauntlet from bad zen to madmen. And as history has oft taught us with respect to Gold, its rising in response to geo-jitters generally then leads to its settling back lower as society returns to being consumed by complacency. Rather, regular readers know our take is that Gold ought rise as the natural mitigant to the proliferation of baseless currencies -- and stay up there. But instead, our precious yellow metal is again dealing for the Twentieth Time with the dreaded 1200 flip-flop. To wit:
Gold first closed above 1200 almost six years ago on 02 December 2009. Inclusive of that initial foray into what was then uncharted territory, Gold has moved from the 1100s up into the 1200s 20 times on a closing basis, the most recent occurrence being this past Thursday. Each instance of closing a session by having crossed the threshold back up into the 1200s makes us anticipative that we can wash our hands of the 1100s "forever!" The only problem with our spirited assessment is that all 20 upside crossings have eventually succumbed back down in the 1100s, this latest instance seeing Gold settling out the week yesterday (Friday) at 1198.
Moreover, any merriment in having achieved 1200 time-and-again borders on being moronic given that such level is anything but celebratory. Rather 'tis downright depressing, if for no other reason than by currency debasement alone, Gold ought today be 'round 2500 as depicted in our Gold Scoreboard. But price having now made those 20 round-trip flip-flops across the 1200 line is indeed making that level appear as a "line in the sand". And all 20 flip-flops are in the following chart of Gold's closing prices since having first achieved 1200 back in '09; the sandy-looking horizontal line is 1200:
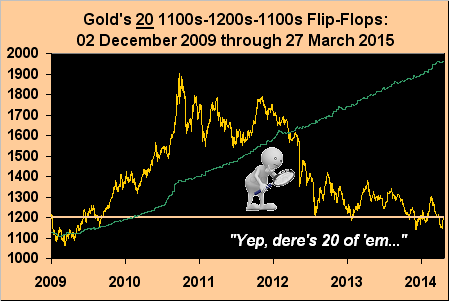
"Hold it a sec there, mmb. What's that pale green line that keeps goin' up, huh?"
Oh that, Squire. That over the identical time frame is the M2 measure of the US Money Supply. Even unlabeled, isn't it obvious? Courtesy: the Federal Reserve Bank's "What's Wrong With This Picture Dept."
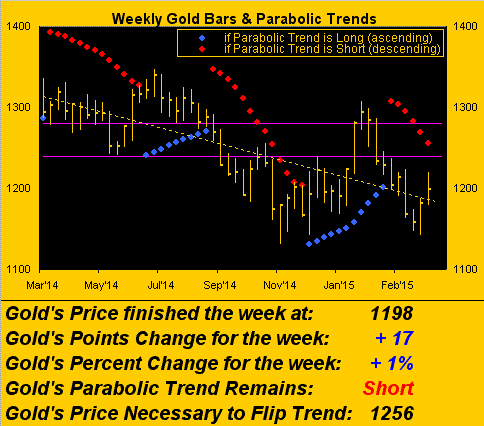
In any event, having just flopped back yesterday below 1200 for the 20th time, 'twill be likely short-lived from our purview, as in next going to the graph of Gold's weekly bars, the case for a 21st flip up into the 1200s is nigh. Gold has just bolted together two back-to-back BuySide weeks. In fact, the distance from Gold's two-week low (1141.6) to its two-week high (1219.5) is price's fourth largest percentage gain (6.8%) since the week ending 25 October 2013, better than a year and a half ago. And given that Gold's expected weekly trading range is currently 44 points, the remaining distance (58 points) to the parabolic Short-to-Long flip price of 1256 is coming into reach, that level itself in a week's time expected to be down to 1243 with the next red dot then all but sitting on the base of the 1240-1280 resistance zone as bounded by the purple lines:
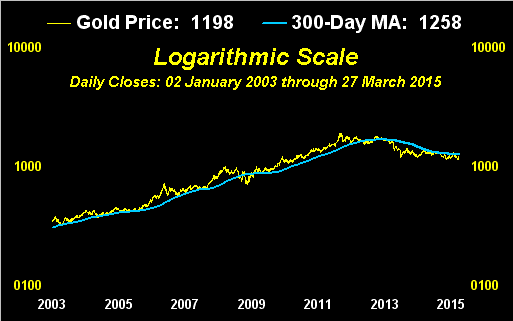
Now to the broad measure of Gold vis-à-vis its 300-day moving average. In having looked above at "flip-floppin' 1200" as a line in the sand, so too does the near-flattening of the average (now 1258) appear as a horizontal frontier when viewed on a logarithmic scale as we have here, which of its own accord puts Gold's pullback during these last few years into a less daunting perspective:
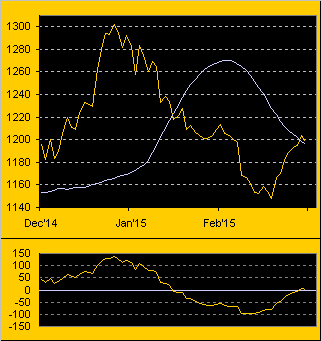
Recall two weekly missives ago the notion of Gold being way too low? This next graphic updates Gold's price relative to its smooth pearly valuation line derived from comparative movements in the markets that comprise BEGOS (Bond / Euro / Gold / Oil / S&P). From way too low to way to go! Here's the three-month view of daily closes:
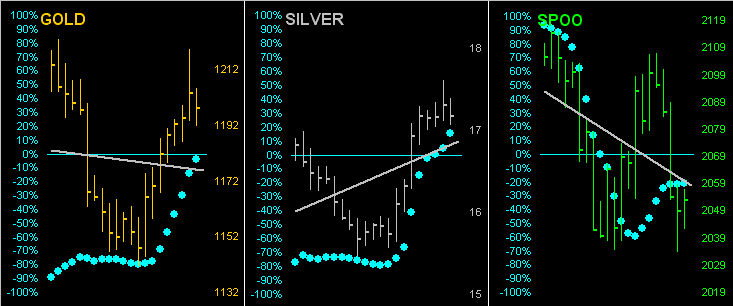
Next let's bring up the daily bars of Gold (left) along with those for Silver (center) and the S&P 500 (right), incorporating their respective 21-day linear regression trends and "Baby Blues", those dots defining the trends' consistencies. Note that, although the price patterns of the Precious Metals appear very similar to one another, 'tis Sister Silver that is leading the charge, her trend already having turned positive; further, instead of wearing her industrial metal jacket, she's adorned in her precious metals pinstripes in accordance with Gold's pricing track, rather than following that of the chaotic S&P, which of its own accord has been reduced to a nervous wreck with what we believe is at least one of the Three Cs (Correction/Collapse/Crash) in the balance:
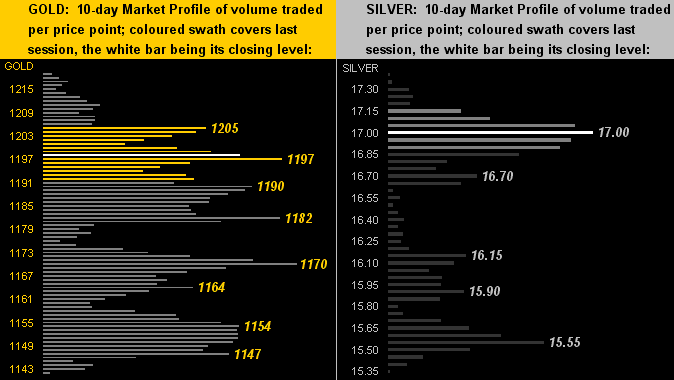
As to pricing immediacy, we now turn to the 10-day Market Profiles for both Gold (left) and Silver (right). Both Precious Metals have clearly-defined underlying support prices as therein labeled. Should Gold quickly move up to take out 1205, we ought anticipate a third consecutive higher weekly high. Sister Silver's support structure appears a bit more cavernous, but as she's in price harmony with Gold, up with one ought mean up with the other:
Finally, here we've the State of the Stack, followed by more March Madness in which we reference a curious story and relate it to Economic Barometer:
The Gold Stack
Gold's Value per Dollar Debasement: 2495
Gold’s All-Time High: 1923 (06 September 2011)
The Gateway to 2000: 1900+
The Final Frontier: 1800-1900
The Northern Front: 1750-1800
On Maneuvers: 1579-1750
The Floor: 1466-1579
Le Sous-sol: Sub-1466
Base Camp: 1377
Year-to-Date High: 1307
Neverland: The Whiny 1290s
The 300-day Moving Average: 1258
The Weekly Parabolic Price to flip Short: 1256
Structural Resistance: 1241
Resistance Band: 1240-1280
10-Session directional range: up to 1223 (from 1146) = +78 points or +7%
Trading Resistance: 1205
Gold Currently: 1198, (weighted-average trading range per day: 17 points)
Trading Support: 1190 / 1182 / 1170 / 1164 / 1154 / 1147
10-Session “volume-weighted” average price magnet: 1177
Year-to-Date Low: 1141
Structural Support: 1033
And thus out the door we March with this final bit of Madness: You may have caught this past week -- on Milwaukee's "Working for You" all-digital flamethrower WDJT -- that due to the bettering economy, some 1,000 Wells Fargo folks are to be laid off in the bank's areas of foreclosures, short sales, collections and other mortgage problems, our supposition being that these are no longer material issues. But fear not, oh those of you let go! For before your severance and unemployment checks run dry, you'll be back in those jobs flying high. Here's why...
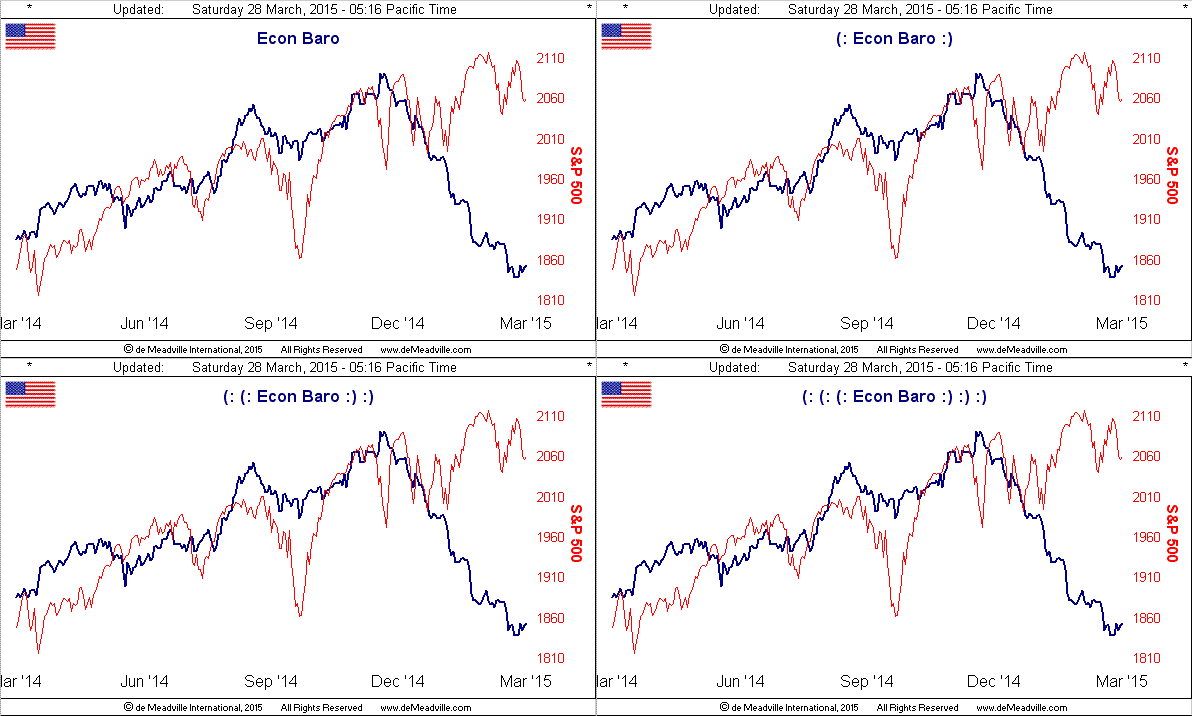
...course those who've been making the loans may then be told "bye-bye". But there remains a marvelous workaround: manage the madness of it all by taking on a bit of Gold and become enriched by that which you hold!
And with respect to the above Econ Baro, it gets a solid dose of some 20 incoming reports next week, the employment components of which will be reported on Friday in spite of the non-electronic markets' closures. But we'll keep the Baro updated at the website throughout!