Get 40% Off
⚠ Earnings Alert! Which stocks are poised to surge?
See the stocks on our ProPicks radar. These strategies gained 19.7% year-to-date.
Unlock full list

Gold Holding In Familiar Range, SPX 500 Makes Good On Reversal Signal

Published 01/05/2015, 05:32 AM
Updated 07/09/2023, 06:31 AM

Talking Points:

  • US Dollar Opens 2015 With Largest Advance in Three Weeks
  • SPX 500 Beginning to Make Good on Bearish Technical Setup
  • Crude Oil Vulnerable to Deeper Losses, Gold Treading Water

US DOLLAR TECHNICAL ANALYSIS – Prices are attempting to continue building higher having started 2015 off with the largest daily rally in three weeks. A daily close above the 50% Fibonacci expansionat 11648 exposes the 61.8% level at 11719. Alternatively, a reversal below the 38.2% Fib at 11577 opens the door for a challenge of the 11489-522 area marked by the December 8 top and the 23.6% expansion.
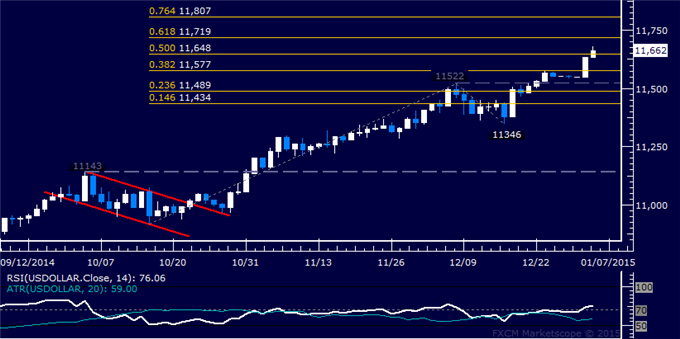
USD Chart

S&P 500 TECHNICAL ANALYSIS – Prices turned lower as expected after putting in a bearish Evening Star candlestick pattern. Sellers now aim to challenge the 23.6% Fibonacci retracement at 2028.00, with a break below that on a daily closing basis exposing the 38.2% level at 1988.00. Alternatively, a reversal back above the 14.6% Fib at 2052.60 aims for the December 5 high at 2079.60.
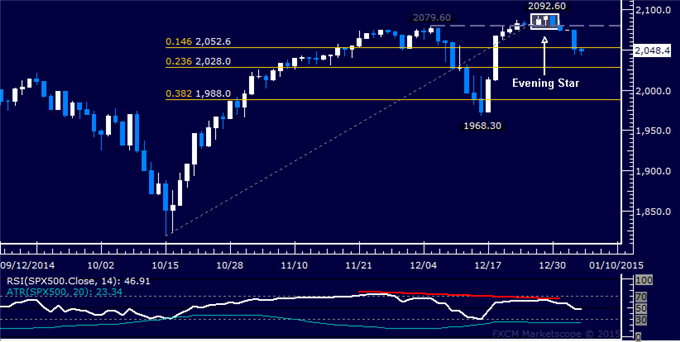
S&P Chart

GOLD TECHNICAL ANALYSIS – Prices continue to consolidate above the December 22 low at 1170.59. A break below that on a daily closing basis exposes the 38.2% Fibonacci expansion at 1156.00. Alternatively, a reversal above rising trend line support-turned-resistance at 1206.23 targets the December 9 high at 1238.13.
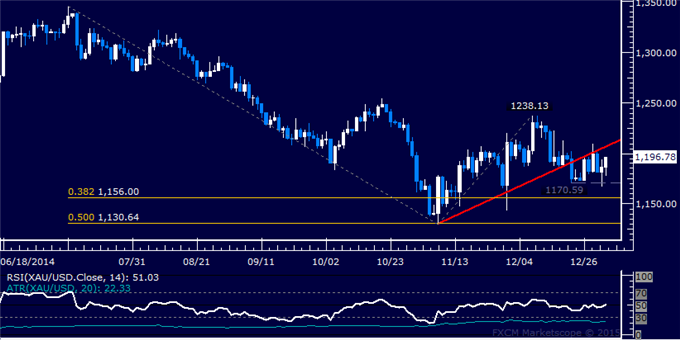
Gold Chart

CRUDE OIL TECHNICAL ANALYSIS – Prices are aiming to extend losses after breaking support at 58.20, the 23.6% Fibonacci expansion. Sellers now aim to challenge the 38.2% level at 54.83, with a further push beneath that targeting the 50% Fib at 52.10. Alternatively, a reversal back above 58.20 aims for the December 18 high at 63.65.
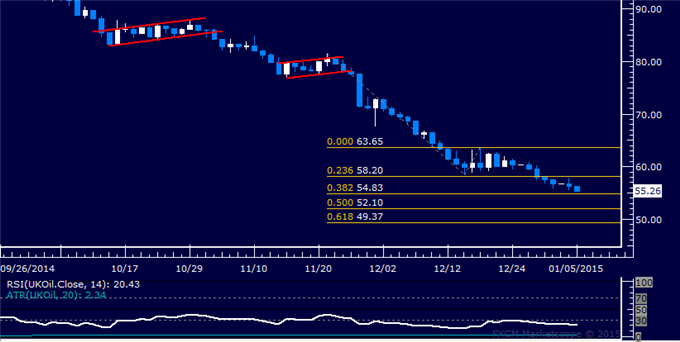
Crude Oil Chart

Original post

Latest comments

Risk Disclosure: Trading in financial instruments and/or cryptocurrencies involves high risks including the risk of losing some, or all, of your investment amount, and may not be suitable for all investors. Prices of cryptocurrencies are extremely volatile and may be affected by external factors such as financial, regulatory or political events. Trading on margin increases the financial risks.
Before deciding to trade in financial instrument or cryptocurrencies you should be fully informed of the risks and costs associated with trading the financial markets, carefully consider your investment objectives, level of experience, and risk appetite, and seek professional advice where needed.
Fusion Media would like to remind you that the data contained in this website is not necessarily real-time nor accurate. The data and prices on the website are not necessarily provided by any market or exchange, but may be provided by market makers, and so prices may not be accurate and may differ from the actual price at any given market, meaning prices are indicative and not appropriate for trading purposes. Fusion Media and any provider of the data contained in this website will not accept liability for any loss or damage as a result of your trading, or your reliance on the information contained within this website.
It is prohibited to use, store, reproduce, display, modify, transmit or distribute the data contained in this website without the explicit prior written permission of Fusion Media and/or the data provider. All intellectual property rights are reserved by the providers and/or the exchange providing the data contained in this website.
Fusion Media may be compensated by the advertisers that appear on the website, based on your interaction with the advertisements or advertisers.
© 2007-2024 - Fusion Media Limited. All Rights Reserved.