Gold lost 2½ points for the week. Boring? Hardly. And thereto, we give a most deserved tip of the cap to Captain Endicott, who a week ago advised us to return to our seats and buckle up as turbulence aboard Gold's flight was imminent. He was right. Gold went rockin'-'n'-rollin'-'n-gettin' bounced about but good, racking up its widest weekly trading range (46 points) since that ending 06 March (60 points). 'Twas also one of Gold's wildest recent weekly rides, for with reference to that prior wherein "nobody really had a clue as to what to do", the past one had 'em slave to abruptly changing altitudes in incidents of bolting higher on Tuesday by ten points in five minutes, getting slammed down on Wednesday by seven points in one minute, and on balance threatening the supply of those little white bags in the seat-pockets. Here is Gold's flight across the entirety of this past week via 15-minute bars:
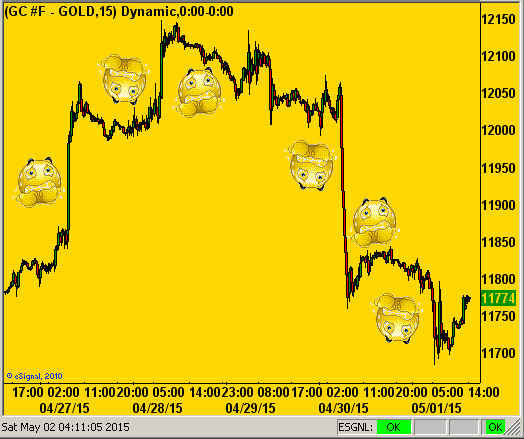
How's that meclizine workin' out for ya? And following all the being jostled-'n-jarred up-'n-down, 'tis incredulous that Gold not only is almost exactly where 'twas at this time a week ago, but as we go to our updated standings of the BEGOS Markets year-to-date, the yellow metal is off just a mere ½% with the first trimester, plus a day, in the books:
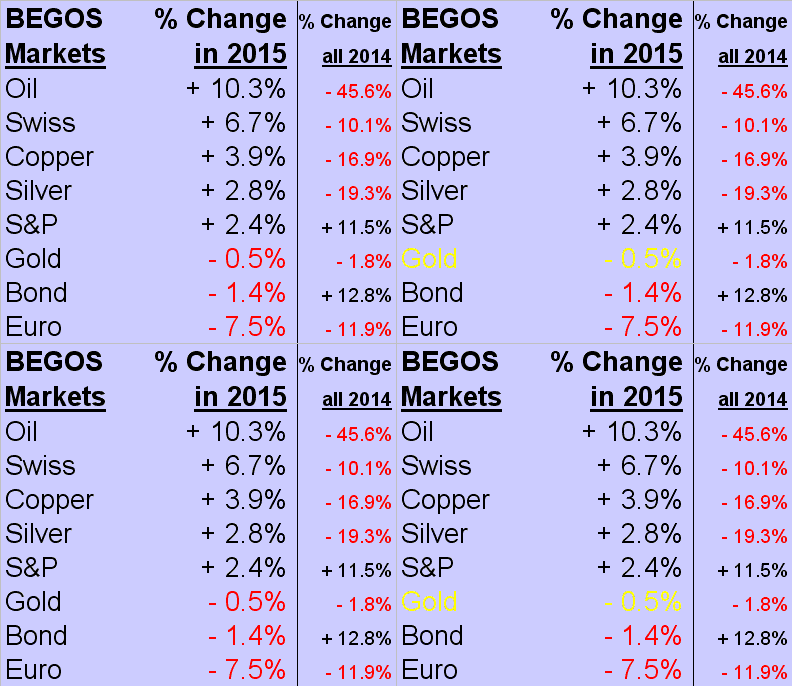
And as regards the "Dollar strength" FinMedia crowd out there, we don't hear a wit from them about "Franc strength", the Helvetian currency (now detached from the €uro) in second place only to oil, and stronger year-to-date (+6.7%) than is the Dollar Index (+5.3%). "Another slice of emmental please, and this time slap some of that Gold mustard on it, won't you? Merci vielmal!"
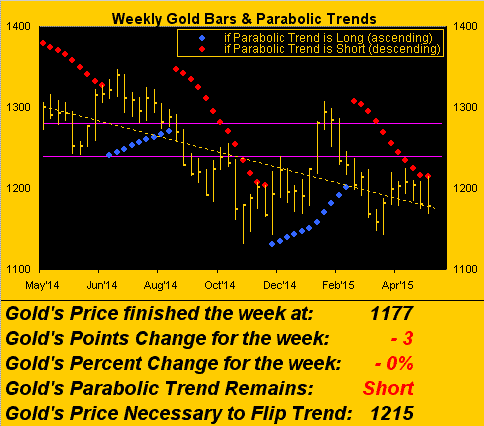
Indeed cheese, let alone translating Schwizerdütsch, may not be that appealing if one is still queasy from the week's journey, but as we next turn to Gold's weekly bars, oh how close came price to fully eclipsing the red dots! Gold on Tuesday was within two points of flipping the parabolic trend from Short to Long. Admittedly, 'tis only an arbitrary measure to be sure, but hardly the first time wherein we've sensed that certain entities -- who can come to market with such size as to materially and swiftly move Gold -- keep an evil eye on this very chart and say: "Well, that's it: we're about to hit those red dots, so Short 10,000 cacs at the market! Then we'll quietly buy 'em back piecemeal after the plunge so we don't move price back up." 'Tis an outrage:
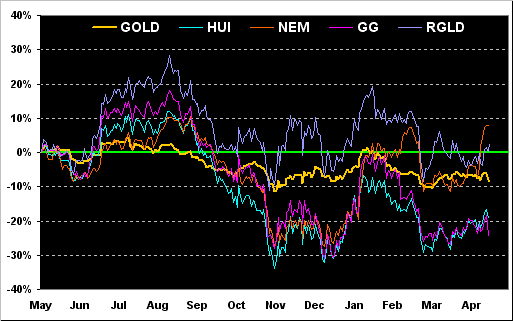
Moreover, with the calendar flipping to a new month, let's also go year-over-year with Gold and some equities brethren. Note that we've changed the mix a bit, as suggested by a valued charter reader of The Gold Update. Because the Gold Bugs Index ("HUI"), Philly Exchange Precious Metals Index (XAU) and the exchange-traded fund for the miners (ARCA:GDX) almost universally have their percentage changes practically on top of one another, we've substituted the latter two in the following chart with two popular common stocks: Newmont Mining (NYSE:NEM) and Goldcorp Inc (NYSE:GG). Of course, still included is the roller-coaster rockin'-'n-rollin' Royal Gold Inc (NASDAQ:RGLD). Presently, NEM's the locomotive and GG's the caboose:
Now as for the Federal Reserve Bank's Federal Open Market Committee not ruling out an interest rate increase this year, one wonders if they'd already composed their Policy Statement without the benefit of knowing the Q1 Gross Domestic Product malaise, which on Wednesday was released only 5½ hours before the Statement was issued.
"Oh c'mon, mmb, you know the Commerce Dept.'s gotta tip 'em off, eh?"
No, neither you nor I know that, Squire. But it really doesn't matter, for you've heard the expression about "symbolism over substance"? With respect to the Fed, 'twould appear we have "credibility over crisis". Either way, remember: the mandate of the Department of Commerce's Bureau of Economic Analysis is to "promote a better understanding of the U.S. economy by providing the most timely, relevant, and accurate economic data in an objective and cost-effective manner". Which is, in a way, what our Economic Barometer shows us every day of the week, (as opposed to once per quarter). The point is: regardless of the FOMC perhaps knowing ahead of time what the poor GDP data was for Q1, its practically no-growth state (+0.2% -- one-fifth of that which was "expected" -- and even worse than the UK's anemic +0.3% growth) shouldn't be surprising to anybody. In fact what is surprising is that the number was not negative! To wit:
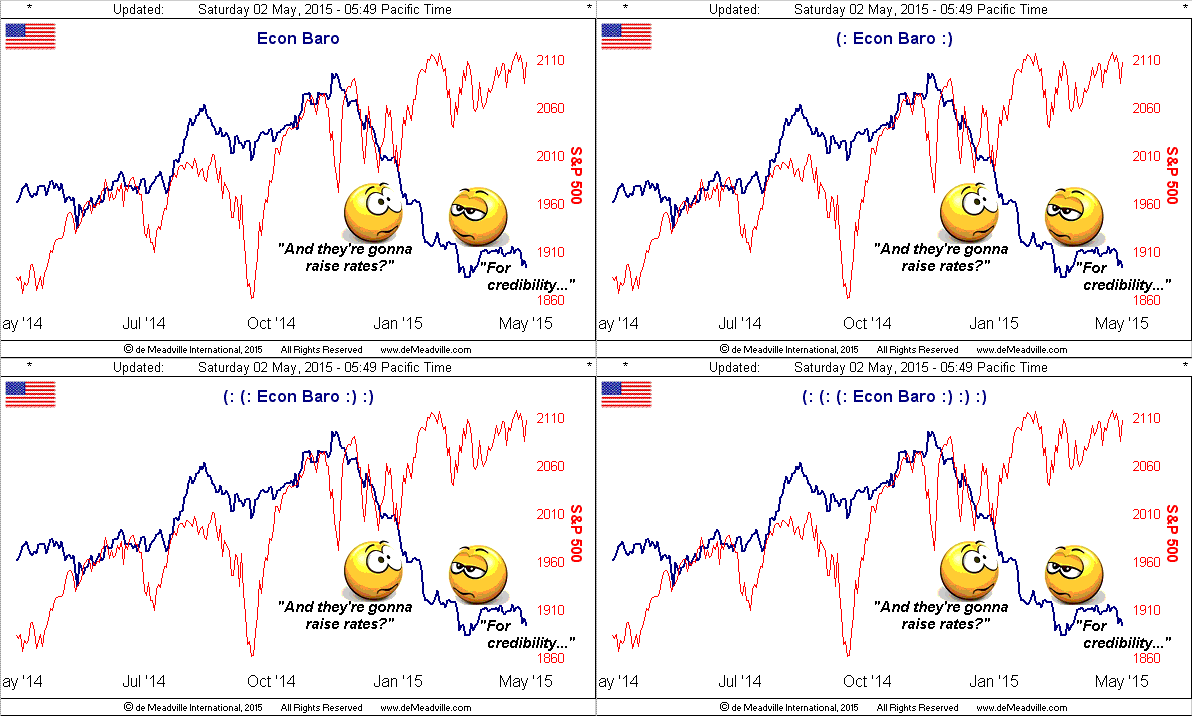
By the way, if your kid's homework assignment is to find an example of divergence, send 'em back to school with the above Econ Baro. (And for extra credit, let 'em wax eloquent on the adjective "correction-less" as described by the S&P 500). Next week's stream of incoming Econ Data, which includes the Payrolls report on Friday, is expected to show net improvement, so we'll see if the Baro either gets a grip, else records further slip.
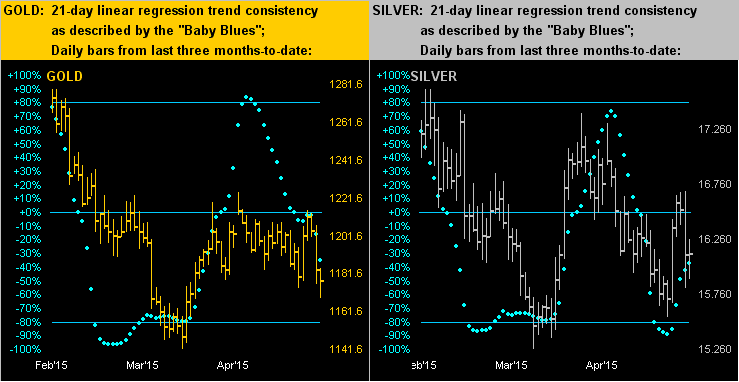
Continuing with the Precious Metals, we bring Silver into the mix in displaying the daily bars for the last three months along with those "Baby Blues" that depict 21-day linear regression trend consistency. Note how Gold on the left has not weathered the recent turbulence as well as has Sister Silver on the right. Gold has made a recent lower low and the blue dots are descending; conversely, Silver has made a recent higher low and her blue dots are ascending. I know it doesn't make a lot of sense to see Gold so suppressed given the spectrum of rationale for it to be much higher than 'tis. Indeed analogous to The Rolling Stones bluesy pop piece from '66 ![]() "Under My Thumb"
"Under My Thumb"![]() 'twould appear as if Gold is smothered under a derrière of vast proportions:
'twould appear as if Gold is smothered under a derrière of vast proportions:
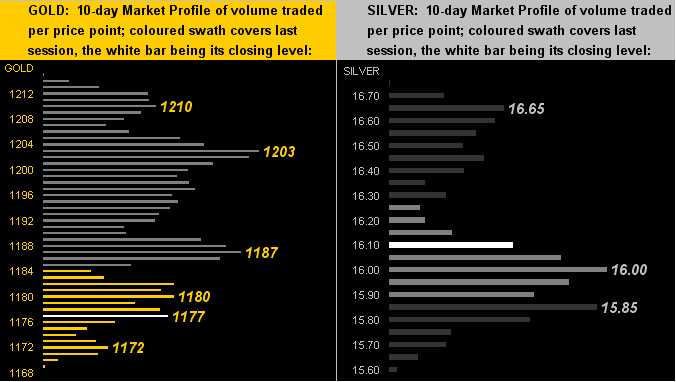
As for the 10-day Market Profiles, they're not overly different in appearance from one week ago, albeit now the yellow metal (left) shows more overhead resistance with which to deal than there is for the white metal (right). Interesting, too, that Gold settled the week at 1177, which you'll recall last week was the last line of near-term support. ![]() "Hang on Goldie, Goldie hang on..."
"Hang on Goldie, Goldie hang on..." ![]() :
:
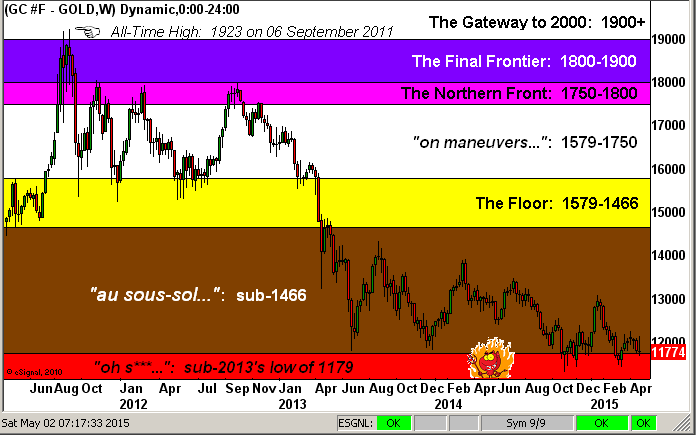
Finally to how it all looks for Gold in the big scheme of things. Here's our structure chart of weekly bars from just prior to Gold's All-Time High-to-date. Still flirtin' and runnin' across those burnin' coals is Gold!
We'll leave you with this from the "Misery Loves Company Dept.": nary a week goes by without one very esteemed member of our Sunday Investor's Roundtable repetitively pounding palm upon knee, exclaiming "What's wrong with Gold? Why isn't it up? The currency's terrible, the geo-political picture is the worst it's been in years, the economy's no where as good as they say it is! Why isn't Gold up? Why isn't it up where you guys say it outta be?" Following such rightfully sensible tirade, the balance of the group all excitedly answer at once with the usual baseless bilge as to why 'tisn't, the cacophonous din generally being a good moment to step over to the bar and refresh one's café.
But the question remains: "Why?" And given the foregoing, at Gold 2000, the answer will be "Because!"