Talking Points:
- Gold surged on safe haven demand but USD strength capped gains
- Crude Oil slid as financial instability weighed on future demand
- Copper weakened after Greek vote result and China’s rate cuts
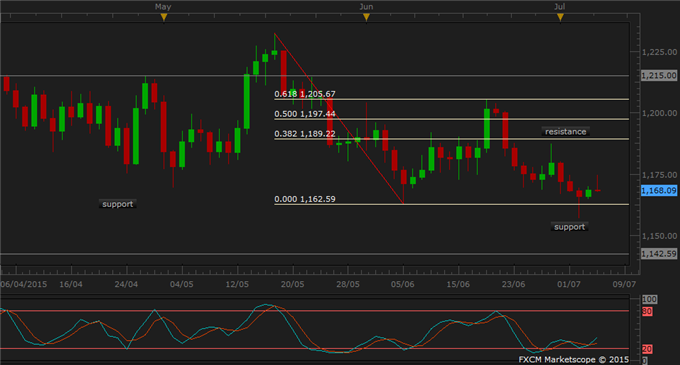
Gold prices gained a 0.6 percent in Asian morning trade as safe haven demand rose after Greeks voted against the creditors’ proposal at Sunday’s referendum. The political stalemate regarding Greek debt is entering uncharted territory with capital controls in Greece and upcoming meetings among European leaders. These ongoing developments will likely provide a baseline for gold prices, with resistance levels coming in at 1180.40 and 1188.00.
However, the upside for gold prices is limited by a stronger US dollar after the Greek vote result. The dollar climbed to the highest level in nearly a month. While uncertainty in Europe may be taken into consideration for the Federal Reserve’s rate hike decision, the expectation of a rate hike this year is likely to continue to restrict gains in gold.
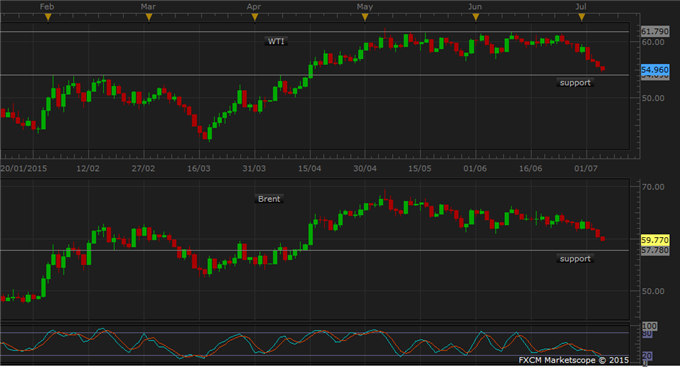
In the same light, crude oil slid after the Greek referendum result hinted at prolonged financial instability in Europe that may weigh down economic growth and demand for oil. Both Brent and WTI oil fell out of their recent ranges. Brent oil dropped below $60 a barrel for the first time since April and is currently facing a support level at 59.13. WTI oil prices fell to the lowest since the middle of April, facing a firm support level at the top of the Jan-Apr consolidation at 54.09.
Coming up on July 7 is a deadline for sanctions negotiations between Iran and six Western countries, where a lifting of Iran’s oil exports sanction may enhance supplies and dampen oil prices further.
Copper shed 0.9 percent in London and 1.4 percent on Shanghai exchanges due to concern that demand may be weakened after the Greek referendum result and China’s moves to stem further losses in domestic equities. While hedge funds were seen buying copper contracts to cover short positions even as stocks fell, the magnitude of loss on stock exchanges may trigger an internal crisis in China which in turn would impact copper demand. The Shanghai Composite has tumbled 29 percent in the past three weeks, erasing $3.2 trillion of value. Over the weekend, 28 initial public offerings had been suspended in China and 21 brokerages agreed to invest at least $19.3 billion into the stock market.
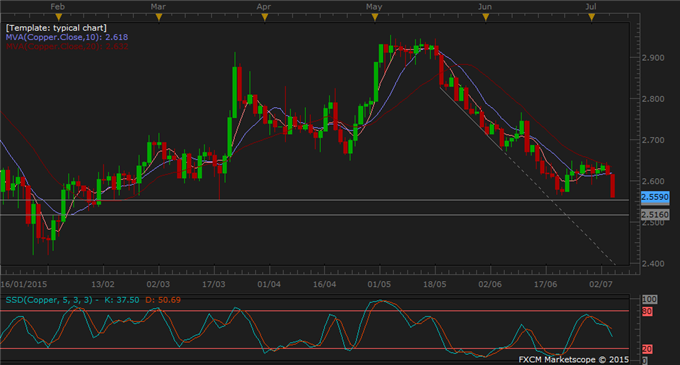
Moreover, China’s rate cuts may clamp down on the copper carry-trade, where the metal had been imported using money borrowed overseas at lower rates then sold for money to be invested at higher domestic rates. Copper is edging lower towards June’s low at 2.5640, a level followed by support at 2.5520.
Volatility in copper prices will likely remain high in the coming days while talks are conducted between European leaders and Greece.
GOLD TECHNICAL ANALYSIS – Gold prices have been contained above support at 1162.50 after a retracing to that level on Friday. Today’s Asian trade sees a slight upside bias in momentum signals for gold. In the absence of any directional moves, large swings will likely dominate price action. Range traders may prefer to wait for a break through resistance at 1189.20 before taking positions.

Daily Chart - Created Using FXCM Marketscope
COPPER TECHNICAL ANALYSIS – Copper prices have fallen past the June’s low at 2.5640 in Asian trade and are currently testing the March low at 2.5520. Momentum signals point to further downside extension. A break of the March low would open the way down towards support at 2.5160 and increase the chances for copper to return to the May-June downtrend. Copper bears may watch for a break of support and/or any rise up to the 20-day moving average to place shorts.

Daily Chart - Created Using FXCM Marketscope
CRUDE OIL TECHNICAL ANALYSIS – WTI and Brent oil broke through the lower bounds of their previous multi-month ranges, and momentum signals still indicate lower moves. WTI oil is testing support at 54.09 which topped price action during the January-March period. A successful break lower would bring WTI into the 50.00-54.00 range that contained prices during the same period, which may precede a test of the big figure at 50.00. Such moves would provide opportunities for oil bears to trade the range.

