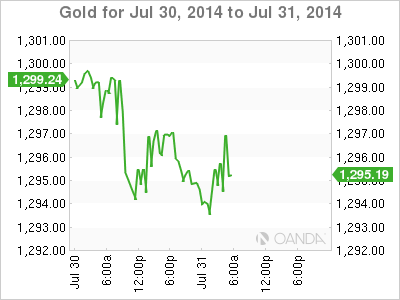
Gold prices are steady on Thursday, as the metal continues to trade close to the $1300 level. In the European session, the spot price stands at $1295.01 per ounce. In the US, today's highlight is Unemployment Claims. The markets are braced for a rise in claims, which would likely have a negative impact on the dollar.
In the US, GDP soared in the second quarter, expanding at an annual rate of 4.0%. This easily beat the estimate of 3.1%. The boost in economic activity was boosted by strong consumer confidence and business activity in Q2. Meanwhile, ADP Nonfarm Payrolls was unable to keep pace. The key employment indicator dropped to 218 thousand, compared to 284 thousand a month earlier. This was well off the estimate of 234 thousand. If the official Nonfarm Payrolls follows suit with a weak reading on Friday, the US dollar could give up its recent gains.
The Federal Reserve released a policy statement on Wednesday, with the Fed sounding somewhat dovish in tone. Policymakers acknowledged lower unemployment levels, but noted that "there remains significant underutilization of labor resources" in the economy. The Fed statement reinforces the view that the US central bank is in no rush to raise interest rates after the termination of QE, which is expected in October. As well, the Fed said that inflation levels have moved somewhat closer to the Fed's target of 2.0%.
CB Consumer Confidence was outstanding on Tuesday, pointing to a sharp increase in June. The key indicator jumped to 90.9 points, crushing the estimate of 85.5 points. This was the indicator's highest level since September 2007. Consumer confidence is closely tracked by analysts since a confident consumer is likely to increase consumption, which is critical for economic growth.

XAU/USD July 31 at 10:05 GMT
XAU/USD 1295.02 H: 1297.35 L: 1294.22
XAU/USD Technical
| S3 | S2 | S1 | R1 | R2 | R3 |
| 1240 | 1252 | 1275 | 1300 | 1315 | 1331 |
- XAU/USD has shown little movement in the Asian and European sessions. The pair touched a low of 1291 late in the Asian session.
- On the upside, 1300 remains under pressure. 1315 is the next line of resistance.
- 1275 continues to provide support. 1252 follows.
- Current range: 1275 to 1300.
Further levels in both directions:
- Below: 1275, 1252, 1240 and 1208
- Above: 1300, 1315, 1331 and 1345
OANDA's Open Positions Ratio
XAU/USD ratio is pointing to gains in long positions on Thursday. This is not consistent with the lack of movement we are seeing from the pair. The ratio has a majority of long positions, indicative of trader bias towards gold prices breaking out of range and moving upwards.
XAU/USD Fundamentals
- 11:30 US Challenger Job Cuts.
- 12:30 US Unemployment Claims. Estimate 303K.
- 12:30 US Employment Cost Index. Estimate 0.5%.
- 13:45 US Chicago PMI. Estimate 63.2 points.
- 14:30 US Natural Gas Storage. Estimate 92B.
