Back in Vietnam Era-1970, ABC produced a comedic film entitled "Suppose They Gave a War and Nobody Came?" And whilst today, on a still sobering note, there are certainly serious pockets of warring going on in strategically important areas from easternmost Europe to the Middle East, the ABCs of markets suggest they themselves should be up in arms over the high level of equities relative to valuation, and moreover the low level of Gold's price relative to the swelling sizes of derivatives, debt and debasement.
Indeed, with all of the recent months' "geo-jitters" ramping up levels of markets' volatility -- such as to have scooted us a bit further to the edge of our seat in anticipation of Gold breaking higher whilst equities just break -- it seemed this past week like Summer out of nowhere had finally arrived -- for at least until Friday it rather has been like watching "Suppose They Opened the Trading Pits and Nobody Came?"
24 hours ago, Gold was actually on track toward putting in its narrowest five-day trading stint since 2007, whilst the S&P 500 had been spending its week climbing out of a technically near-term "textbook oversold" condition. But then at 05:00 Pacific Time, the film snarled, coming off of the projector's sprockets. Gold -- given reports of diminishing India/China demand -- was swiftly hammered to the downside -- only to then recover in full by 09:00 as Ukrainian forces allegedly engaged a Russian convoy, and the Islamic State of Iraq (ISIS) allegedly declared itself as the next Al-Qaeda -- in turn putting the S&P on its fanny: the futures (Spoo) in Black Swan style dropped a whole day's worth of trading range in just 15 minutes.
Here's how that four-hour period unfolded by the minute for Gold and the S&P:
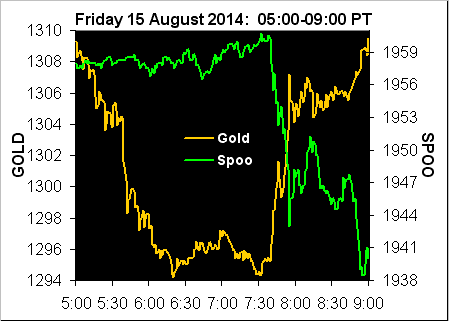
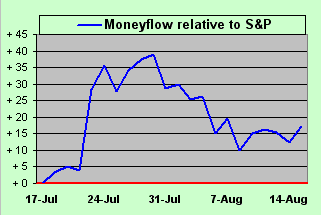
'Course by day's end, the S&P had made up the entirety of its intra-day demise. But having dropped intra-session in a vertical manner of intensity and speed all too reminiscent of 2008, 'twas a reminder of just how fragile the S&P is becoming. Moreover, its underlying moneyflow -- when regressed into S&P points for the last 21 trading days -- although higher than the the Index level itself, has nonetheless been waning since late July-to-date as we see here mid-chart:
Still, despite yesterday's sudden spate of volatility, 'tis otherwise dawning on me as to why the markets have gone quiet, the move higher in Gold seemingly being on hold, as is the smash of an S&P crash: we've not yet reached the September/October timeframe, for that's when folks expect such market malevolence to occur. To quote our fictitious friend Egbert Stapudnick, "Myrtle and I fully expect to be financially flattened, but not until the Fall. Now try one of these here barbecued bräts". Fall indeed. Let's just hope the Stapudnicks understand the ramifications of an S&P price/earnings ratio -- with Q2 Earnings Season now finalized -- at this writing of 36.7x (our "live" reading), along with the ever-present massive imbalance between the price of Gold and levels of global money supplies.
"Same old mmb, always going on about how Gold is too low!"
Ok, Smartypants Squire, here's a calculation for you. The weekly average supply of StateSide M2 from five years-ago-to-date is $9.74 trillion; today's current level is $11.46 trillion. The weekly average price of Gold from five years-ago-to-date is 1417. Now punch out the M2 percentage difference on that El Cheapo plastic calculator of yours, apply it to Gold and what do you get?
"Jeepers, mmb, it says 1666!"
The defense rests, (yet again). 'Course, as we always acknowledge, such result is dependent upon the starting date of the calculation, to which conundrum we simply apply The Golden Rule: "He who has the Gold makes the Rule." Now let's now turn to the week just passed in our one-year view:
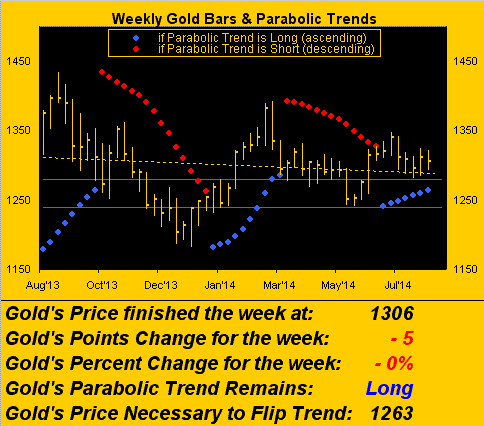
And by the rule of percentage, inclusive of Friday's fury, Gold finished all but unchanged week-over-week, notably again having made a "higher-low", along with the parabolic Long trend's rightmost blue dot having inched up to 1263. As for Gold year-to-date vis-à-vis its 300-day moving average, the latter's having been an upside barrier that repelled price back in March has clearly become more porous...
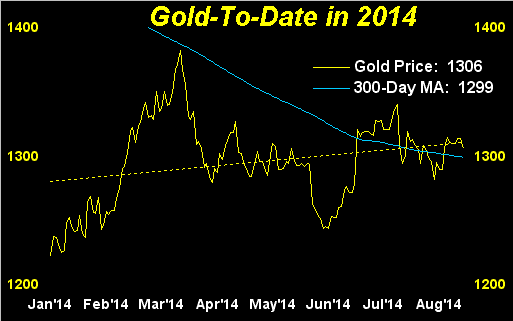
...and moreover, the dashed year-to-date linear regression trendline is positive. 'Course we know amongst the BEGOS Markets (Bond, Euro/Swiss, Gold/Silver/Copper, Oil, S&P), that Gold has been the leader throughout much of the year, albeit currently +8.4%, 'tis in second place behind the safe-harbour Bond which is now +10.1%. But then, as noted in this missive's title, we need to address Sister Silver, which this past week has taken a fairly severe technical warning slap across the face. Here's why.
Our long-time favourite concoction of Silver is to put Gold (a precious metal) along with Copper (an industrial metal) into the Osterizer, depress the purée button, et voilà: Silver. Now having just noted above that year-to-date Gold is +8.4% -- and given that Copper is -8.5% -- where ought that put Silver? Betcha you weren't far off: +0.6%. And the technical warning came at last Monday's close, when Silver's 13-day EMA ("exponential moving average") confirmed crossing and closing below the 89-day EMA. Esoteric mumbo-jumbo perhaps, however the 13/89 EMA series is one of the four cornerstone measures that drive our Market Rhythms analyses that you see at the website. First we've the chart, and then the downside ramifications for the white metal:
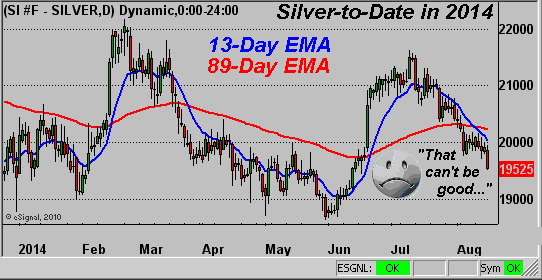
At right you can clearly see the 13/89 EMA downside crossing. Here's what our Market Rhythm for that technical study is thus targeting: in every one of the last 10 such EMA crossings, (i.e. five down and five up), price upon confirmation has then traveled further by at least 0.560 points, (which is $2,800/Silver contract), prior to the signal then confirming its next crossing in the opposite direction. So basis the September Silver contract, we take Tuesday's opening level of 20.015, less those 0.560 points, equals 19.445. Yes, Silver yesterday already traded as low as 19.505, which is not far from that Market Rhythm target of 19.445. But consider this from the warning perspective: should price travel the "median" distance inherit of those prior crossings, price will sink into the 18s, and moreover should it travel the "average" distance of the crossings, 'twill reach down into the 17s.
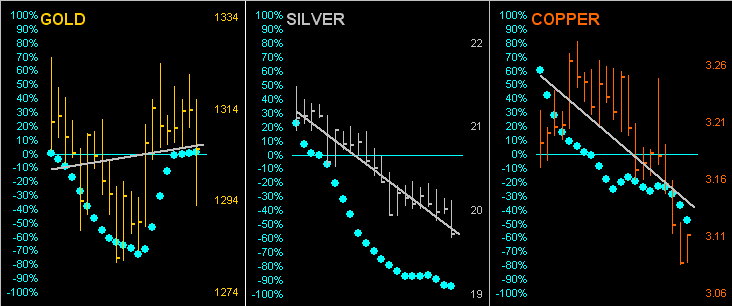
Sister Silver's fans might take heart that no technical signal plays out as expected every time, but once the fragile S&P really lets loose to the downside, especially should it take Cousin "La Rouge" Copper with it, the white metal could well see those 18s/17s unless she can throw off her industrial metal jacket and instead in her precious metal pinstripes sidle up to Gold, assuming it stays firm, and better yet, takes off higher. Still, as the time from one such EMA crossing to the next typically takes some two-to-three months, let us hope Sister Silver is not in for a rocky Fall. And squeezed inbetween Gold and Copper, Silver's last 21-trading days have not been pretty as we view this triad's daily bars along with their "Baby Blues", the dots which measure the diagonal trendlines' consistencies:
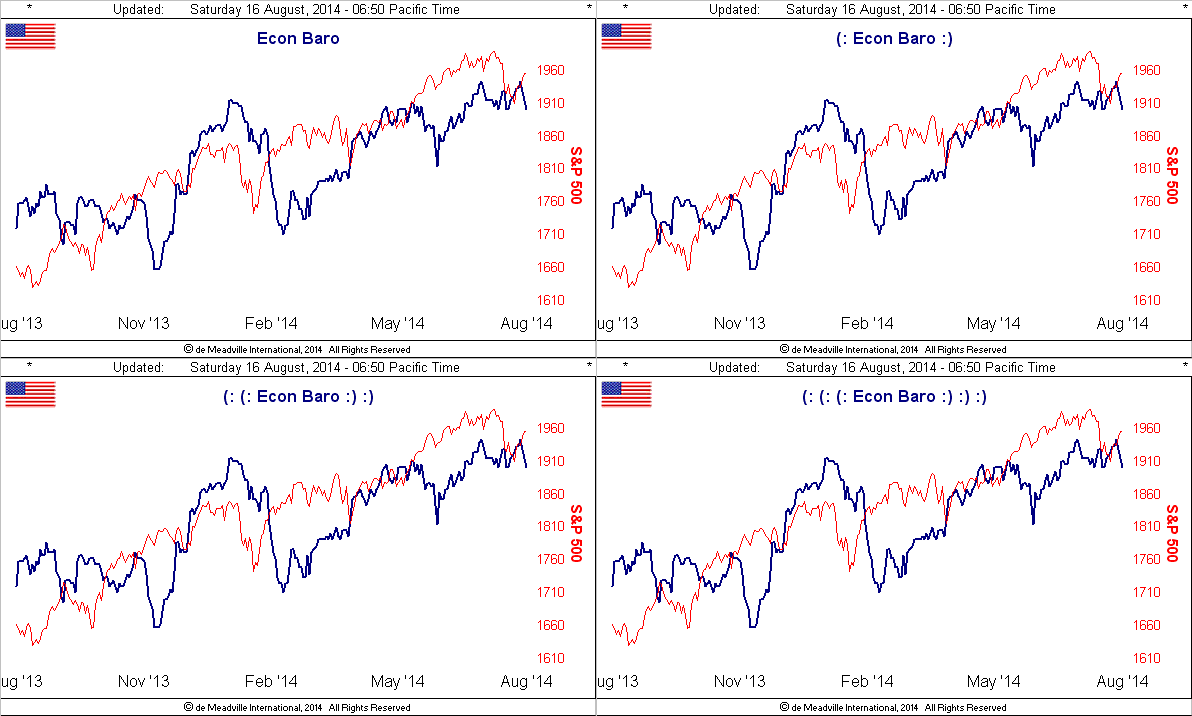
Now with respect to the fragility of the S&P, I heard an analyst interviewed this past week on Bloomy Radio actually say that because earnings are beating estimates there is good value in stocks. How do analysts get away with this stuff? Should earnings not instead be beating the prior year's quarterly number? Of the almost 2,500 companies for which we gathered Q2 earnings data, 45% by our reckoning did not improve year-over-year. And specific to the S&P 500 itself, given yesterday's revelation of such fragility, one wonders just how long the ever-recovering buoyancy can continue. Here's the S&P astride the somewhat stalling Economic Barometer:
And as usual, 'tis not just here on our side of the Pond. The Bank of England has sharply cut its wage growth forecast, construction measures still weak there on the Isles. France's Q2 gross domestic product went as flat as a crêpe, whilst Germany -- yes Germany -- directionally aligned itself with Italy's GDP in going backward. Then further 'round the Globe we've got Japan’s economy shrinking the most since 2011. Given that Gold plays no currency favourites, in the offing there can thus only be more coming from the gift that keeps on giving: faux dough for all -- and inevitably higher Gold prices.
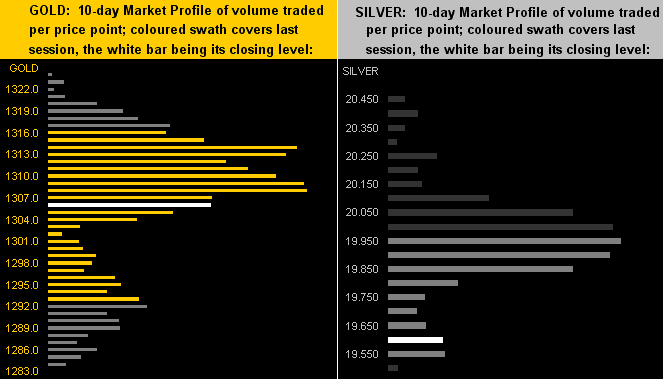
Let's wrap it up here with the 10-day Market Profiles for both Gold and Silver. On the left we've Gold with trading resistance apices above the current 1306 price at 1308 and 1314, and support below at 1292. On the right above Silver's current 19.550 price we've the acme of the broad trading resistance apex at 19.950:
Finally, on the heels of a sleepy-turned-turbulent week, we leave you with some encouraging tasty Golden Goodness news: Burger King, (of which accorded me my first "Whopper" in Miami back in '61), has made the decision to phase out from the majority of their restaurants the low-fat french fries delicacy known as "Satisfries". I applaud that, as honestly, who'd really want 'em? Indeed they perhaps ought go one step further on the culinary side by serving real Belgian pommes-frites. Then slather those Golden babies up with mayonnaise and wash 'em down with some of that Golden ale from Chimay. Now yer cookin'!