Well now I've quite the warm n' fuzzy feeling all over, don't you? And justifiably so. After all, not once but twice this past week did the Federal Reserve Bank's Head Teller, to whom we endearingly refer as Old Yeller, specify that the stock market is not in a bubble. When 'twas first stated on Wednesday before the Joint Economic Committee, I was rather dubious about perhaps having not contextually understood what the Fed Chair was saying, (what else is new...) But then her having reiterated same on Thursday in front of the Senate Budget Committee, there clearly can now be no doubt. And I, for one, am greatly relieved, especially after all these many weeks, indeed months, of having been on "crash-watch".
Silly old mmb am I:
- To have been worrying about the price-earnings ratio of the S&P 500 even today at 29.8x as it hovers 'round pre-2008 crash levels: such antiquated analysis, that.
- To have been concerned with Q1 Earnings Season now having all but run its course such that we tally only 53% of some 2,000+ companies bettering their year-over-year quarterly earnings, (meaning that 47% have not), and therefore having fretted, apparently meaninglessly, that the stock market is better than 30% higher that 'twas at the start of last year: who really gives a derrière du rat, eh?
- To have been marveling at the so-called safety in principal of the 10-year Treasury Note's 2.623% yield as opposed to the at-risk principal and subservient 2.050% yield of the S&P: but then equity is cool whereas debt plays the fool.
Notwithstanding the foregoing, thank goodness there's no bubble.
Still, my concern of folks in retirement running out of money -- indeed monetizing assets including their equities, the yield on which cannot cover life's increasing expenses -- seems at best a back-burnered issue. And as for job participation shrinking as workers either opt or are forced to take that risk of retiring, college grads on the opposite side of the cycle can hardly find gainful employment. Yet 'twould appear there are no worries from the Fed over these realities, (at least for the present: but consider the boost for Gold upon the need for massive new funding to support retired oldsters and jobless young'uns). In the meantime, the stock market is just fine, 'tis the very savings account and wealth of the nation, albeit the housing market appears a bit gamey.
Moreover at the end of the day we've the ongoing inflow of encouraging economic data, despite there being downside risks to growth per reports that the FOMC's "tightening of fiscal policy has led to headwinds that offset the central bank's supportive efforts." What? Nuthin' but Fed as it manipulates us marionettes.
(And as perhaps a preposterous aside, don't think for a moment that the so-called PPT -- traders' acronym for the Fed's "Plunge Protection Team" -- didn't assure Ms. Yellen pre-testimony that 'twas OK to assert that the stock market has not gone bubblicious. But who are the PPT, indeed where are they? Shuffled amongst investment banks' trading desks? Or inconspicuously spread out 'round the globe, typically as some innocent chap perhaps in Riyadh, who goes by the name of "Mikey" and whilst running his petrol station sits in its back office loadin' bids into the S&P Futures GLOBEX trading platform? Conspiratorial perhaps, but one never knows...)
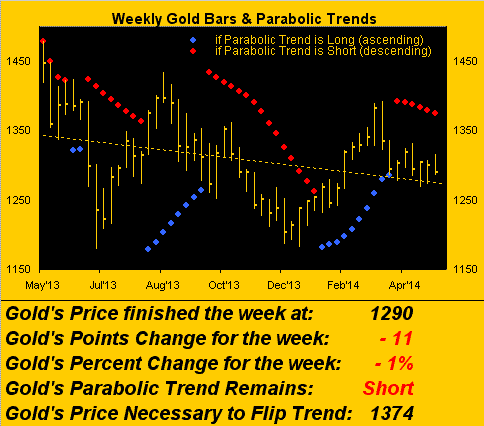
Regardless of whether 'tis fact or fancy, a PPT of sorts seems perceptively lurking out there for Gold thus far this year. Time again in 2014 Gold has precariously lurched right to the edge of 2013-esque tanking only to see buyers come to the fore with a vengeance. And as we turn below to Gold's weekly bars from a year ago-to-date, price is actually higher here at 1290 that 'twas six weeks ago when the parabolic Short trend was triggered at 1286. Of course, four li'l ole points is a blink of an eye in the Gold trade, but had one gone Short with the parabolic signal, one would be behind on such position:
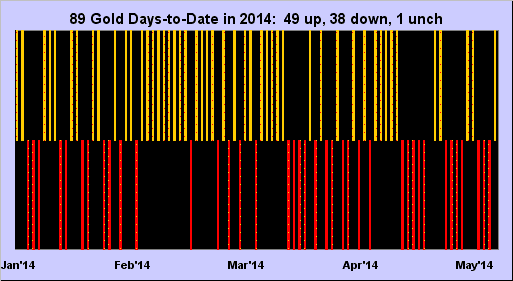
In fact, with respect to our theorem that "change is an illusion" whereas "price is the truth", the following graphic is quite telling, (no there's no need to adjust your set). There've been 89 trading days for Gold so far in 2014. In the chart below, the "columns" (all of which are the same height) are in Gold for up days and in red for down days. Clearly through the right half of the chart, there have been more down days than up days , and yet "price" (the truth) as just noted is higher than 'twas at the parabolic flip six weeks ago in spite of all those down "changes" (the illusion):
Ideally -- and what we've said all along is that which Gold requires to move materially higher, i.e. an increase in its invested base -- is Gold's finally beginning to garner serious ownership interest. Price seemingly being unable to freely tumble to the downside as we saw time and again last year suggests that wiser heads are now prevailing. As noted a week ago, Gold sub-1300 is clearly getting a bid. And rightly so, for in the Big Picture, the currency spigots even with "tapering" remain quite open. To that end, below we've updated the Big Picture of the daily price of Gold from 2009-to-date astride the rise of the StateSide M2 money supply alone. We've seen in the past how their respective tracks practically -- and properly -- were parallel to one another upon quantitative easing really getting ramped up in 2009 upon the Black Swan's flying back to her nest, (from where she doubtless is preparing her next assault, unless she heard Ms. Yellen's comments about there not being a stock market bubble). Again, stark in the center of the chart we see the now infamous segment of Gold's having "gotten ahead of itself". But what say we now?
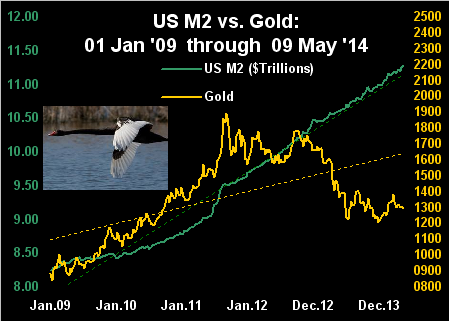
Gold's now being "behind itself" is beyond understatement in the Big Picture. Of course, arbitrary scaling is used to have the two above tracks start from the beginning of 2009; but in maintaining that static scaling, a return back up to the green M2 line means Gold achieving at least 2200, (unless the money supply were to decrease).
As for "The Now", below is a special presentation of the "Baby Blues", not just for Gold (upper right panel), but for the entirety of our BEGOS Markets complex. As regular readers know, the blue dots across the last 21-days for each of these markets represent the consistency of their respective linear regression trends (the diagonal lines). The reason we're showing all eight markets is to point out (perhaps with Oil as exception) the absolute lack of what is normally sweeping, vertical ebbs and flows of the blue dots. Rather, the Baby Blues seem stuck, direction-less and without form. 'Tis quite eerie stuff because such lack of committed direction likely portends the markets at large nearing a period of vast and volatile movement. We quipped a couple of weeks ago that soon we may not be in Kansas anymore: we're still there, but hang on tight, Toto, as the winds may soon be a-whirlin':
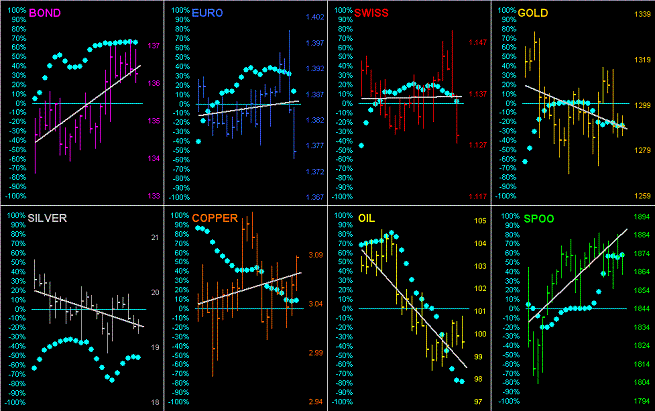
Of note in the above graphic is the somewhat violent drop in the EuroCurrencies for the last two days of the week because of stagnating EuroZone data raising expectations that the European Central Bank shall further ease its monetary policy in June. Moreover came word of HSBC's suffering a 20% drop in profits due to "challenging market conditions" in its investment banking division, whilst Barclays announced 7,000 investment bank job cuts. Obviously, all that boded well for the Dollar Index (not a component in BEGOS) which recorded its fourth largest two-day rise of the year. Yet look above at the last two days for Gold: no further downside effect (!)
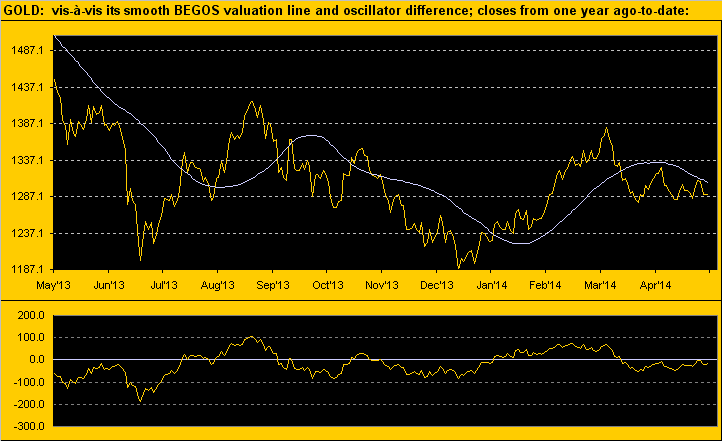
Specific to the yellow metal, here next is its year-over-year view along with the smooth pearly valuation line as derived from price's movement relative to that of the five primary BEGOS Markets (Bond/Euro/Gold/Oil/S&P). Clearly the next penetration of value by price would be to the upside, which in turn per our "traders rule-of-thumb" becomes a buy signal:
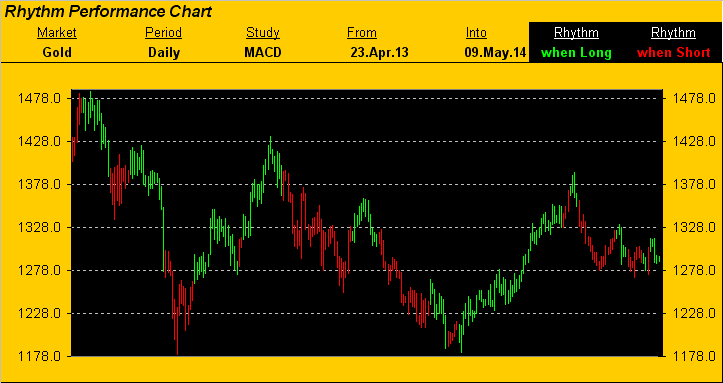
Yet, more evidence as to the lack of recent direction is colourfully highlighted below as we view Gold's daily bars from better than a year ago-to-date, as based on whether the MACD (moving average convergence divergence) study is positively disposed (i.e. in green for "Long") or negatively so (red for "Short"). 'Tis normal to see one colour or the other maintained for a run of many days, which is what makes this trend-following study such a profitable one, (given attentive risk management). But look at the very rightmost spate of recent days: more flip-flops than even the most controversial of politicians:
"But which way is it actually going to break, mmb?"
My bet is higher, Squire, if for no other reason than Gold has been handed every chance on the planet to plummet as it so did a year ago, and yet the buyers -- be they a patchwork PPT, simply common sense investors, and/or banks both private and sovereign -- continue as noted to come to the fore.
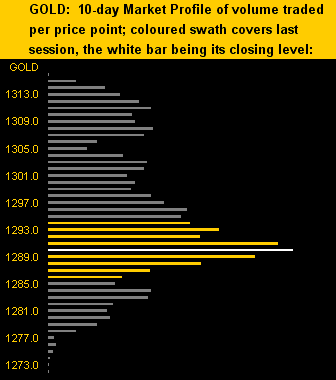
What's more, behold Gold's 10-day Market Profile, therein noting the week's closing level of 1290 (white bar) as the most commonly-traded price this past fortnight:
We trust 'tis a launch pad rather than a cliff.
Let's wrap it up with two quick notes followed by the Gold Stack:
1) 'Twas herein embellished a week ago China's being on track to surpass the USA en route to Economy Numero Uno, albeit a private survey now reveals their manufacturing sector as having contracted for a fourth consecutive month in April. To be sure, as do markets, economic also data ebbs and flows, but here's the daunting bit: there apparently is a somewhat struggling vehicle manufacturer in China called Great Wall Motor Co. With a name like that, I doubtless shan't be a customer of theirs.
2) My beloved France has banned the import of live pigs from the USA and Japan per the "Hog Epidemic", the details of which you don't wish to know. However, since our French friends routinely live high on the hog with porc-de-this and jambon-de-that, I would be wary of a cultural depression setting in, especially should you find yourself touring France this summer. Just a deux-sous heads-up for our valued bons vivants readers out there.
Here's the Tour of the Gold Stack:
Gold’s All-Time High: 1923 (06 September 2011)
The Gateway to 2000: 1900+
The Final Frontier: 1800-1900
The Northern Front: 1750-1800
On Maneuvers: 1579-1750
Structural Resistance: 1479 / 1524-1535
The Floor: 1466-1579
Le Sous-sol: Sub-1466
Year-to-Date High: 1392
The Weekly Parabolic Price to flip Long: 1374
Base Camp: 1377
The 300-day Moving Average: 1343
10-Session directional range: 1316 down to 1272 = -44 points or -3%)
Trading Resistance: 1303 / 1308 / 1311
10-Session “volume-weighted” average price magnet: 1296
Gold Currently: 1290, (weighted-average trading range per day: 17 points)
Trading Support: right here at 1290, plus 1284
Structural Support: 1280-1240 / 1227 / 1163 / 1145
Year-to-Date Low: 1203
After a dearth of economic data in the week just past, (Old Yeller's "no bubble" remarks notwithstanding), we count 19 incoming items for the Economic Barometer next week which you can watch progress day-by-day at the website, along with the final tallies for Q1 Earnings Season.