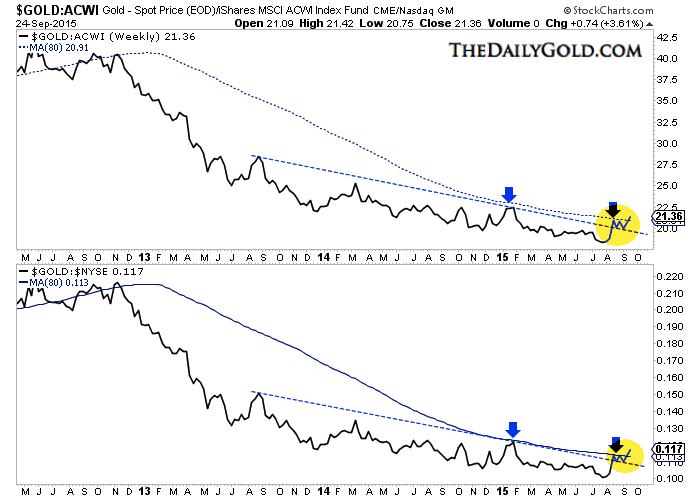
The vicious and ever enduring bear market in precious metals has coincided, amid a strong negative correlation, with a bull market in equities. The negative correlation is nothing new as it occurred and persisted from 1973 through 1978 and also from 1996 through 2002. We’ve said gold could not begin a new bull market until the correlation flips in favor of gold. For the first time in three years various gold/equities ratios are trading above the 80-week moving averages. This is an important development as it indicates the bear market in precious metals is very close its end.
We plot weekly data for gold/iShares MSCI ACWI (ACWI) (global equity ETF) and gold/{{|NYSE Composite}} in the chart below. These ratios have started to move in favor of gold. Both ratios tested the 80-week moving average in January 2015 and then again in August 2015. The ratios are very likely to close this week above the 80-week moving average for the first time in three years. The next step is for the ratios to close above their January 2015 highs, which would mark a new 52-week high.
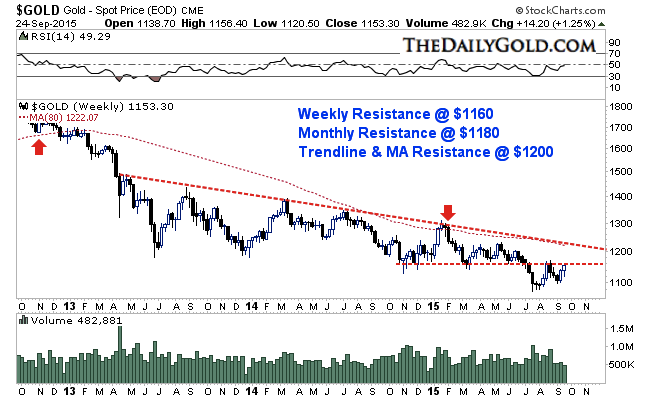
Gold’s budding strength against global equities is very positive but it does not necessarily signal a gold bottom in nominal terms. If gold has already bottomed then it has quite a bit of work to do to confirm the low. Ultimately, gold would exceed the January 2015 high at $1300 but there is plenty of other resistance along the way. First, lets see if gold can close the week above $1160. Second, it has to close above $1180 on a monthly basis. Then it would need to surpass a confluence of resistance at $1200.
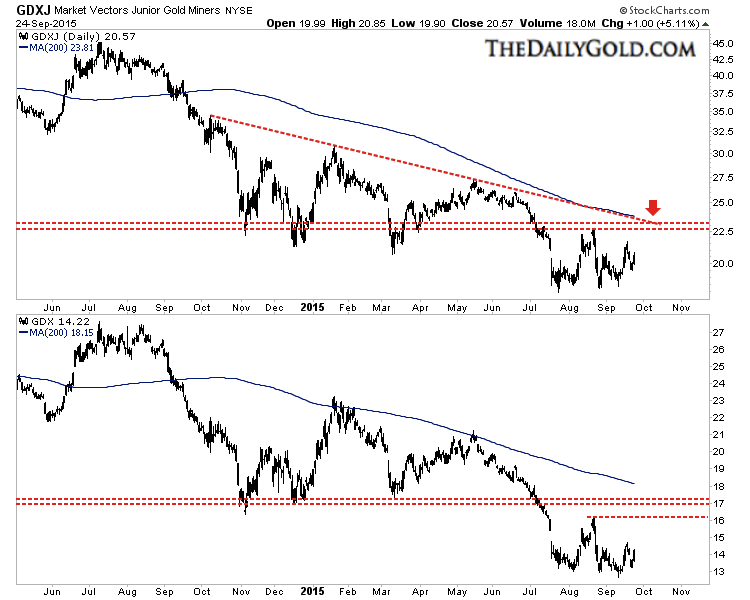
One reason I’m skeptical that gold will sustain current strength is it has not generated much excitement in the miners which tend to lead Gold. If the miners had formed a true double bottom then they would have exploded through resistance by now. It is certainly possible (NYSE:GDXJ) could test $23 and (NYSE:GDX) could test $16-$17 but that in itself is not an indication of a new bull market or bottom in gold.
One of the two things we’ve waited for appears to be in motion. Gold is starting to breakout against equities. This is a huge positive but it does not signal that gold has bottomed. Unless gold can takeout the confluence of resistance at $1200 then our view remains it will break below $1080 and make a final low. It’s possible the miners (GDX, GDXJ) could rally to resistance but rather than chase strength, we would be most comfortable buying and accumulating the best junior miners soon after gold loses support at $1080. The weeks ahead figure to be very volatile and very interesting for all markets.


