Gold for Tuesday, September 23, 2014
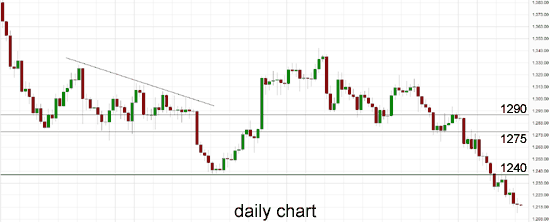
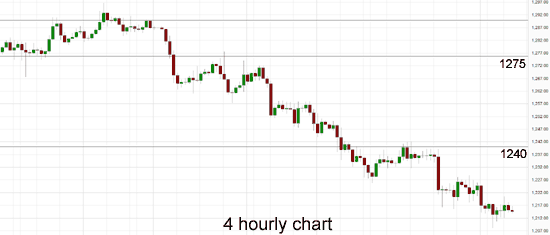
Gold has remained quite steady to start this new week, around $1215. It is enjoying some consolidation after finishing last week having fallen strongly from $1240 to just below $1215. After finding some support around $1225 for a few days to start last week, it rallied back close to $1240. Gold then fell sharply to its lowest level since January this year.
The next obvious level of potential support is at $1200 which is a long term key level. If gold was to fail at this level, then it is likely the flood gates will open and the shine will have definitely worn off. Several weeks ago Gold was enjoying a resurgence as it moved strongly higher off the support level at $1275, however it then ran into resistance at $1290. In the week prior, Gold had been falling lower back towards the medium term support level at $1290 however to finish out last week it fell sharply down to the previous key level at $1275. Over the last month or so the $1290 level has shown some signs of support and held gold up until its recent sharp decline. During the second half of June, gold steadily moved higher but showed numerous incidents of indecision with its multiple doji candlestick patterns on the daily chart. This happened around $1320 and $1330.
The OANDA long position ratio for Gold has dropped sharply back down below 70% as it has also fallen a little further. At the beginning of June, gold did very well to repair some damage and return to the key $1275 level, then it has continued the momentum pushing a higher to its recent four month high. After moving so little for an extended period, gold dropped sharply back in May from above the well established support level at $1275 as it completely shattered this level falling to a four month low around $1240. It remained around support at $1240 for several days before its strong rally higher. It pushed down towards $1280 before sling-shotting back and also had an excursion above $1300 for a short period before moving quickly back to the $1293 area again. Over the last few weeks gold has eased back from around $1315 to establish its recent narrow trading range below $1295 before its recent slump.
Way back in March, the $1275 level established itself as a level of support and on several occasions has propped up the price of gold after reasonable falls. Throughout the second half of March gold fell heavily from resistance around $1400 back down to a several week low near support at $1275. Both these levels remain relevant as $1275 continues to offer support and the $1400 level is likely to play a role again should gold move up higher. Through the first couple of months of this year, gold moved very well from a longer term support level around $1200 up towards a six month higher near $1400 before returning to its present trading levels closer to $1300.
Gold prices edged up on Monday on short covering after a dollar rise and technical selling sent the precious metal into its weakest since early January earlier in the day. Silver also nearly erased earlier losses after falling to a four-year low, with the prospect of rising U.S. interest rates undermining precious metals and industrial commodities dented by worries over Chinese demand. Caught on both counts with dual roles as an industrial metal, widely used in electronics, and as an investment vehicle, silver had tumbled more than 3 percent in just 40 minutes in early Asian trade to hit its lowest since mid-2010 at $17.30 an ounce. By late morning it had recovered to $17.79 an ounce. As well as a retreat in gold prices, which hit 8-1/2 month lows on Monday, weakness in other industrial metals had weighed on silver, analysts said. Sector bellwether Copper hit a three-month low on Monday and other base metals retreated on demand concerns ahead of manufacturing data from top consumer China.


Gold September 23 at 00:20 GMT: 1214.7 H: 1216.7 L: 1213.9
Gold Technicals
| S3 | S2 | S1 | R1 | R2 | R3 |
| 1200 | --- | --- | 1290 | 1330 | --- |
During the early hours of the Asian trading session on Tuesday, Gold is trading in a narrow range right around $1215 after remaining quite steady for the last 24 hours or so. Current range: trading right around $1215.
Further levels in both directions:
• Below: 1200.
• Above: 1290 and 1330.
OANDA's Open Position Ratios
![]()
(Shows the ratio of long vs. short positions held for Gold among all OANDA clients. The left percentage (blue) shows long positions; the right percentage (orange) shows short positions.)
The long position ratio for Gold has dropped sharply back down below 70% as it has also fallen a little further. The trader sentiment is strongly in favour of long positions.
Economic Releases
- 22:45 (Mon) NZ Trade Balance (Aug)
- 08:00 EU Flash Manufacturing PMI (Sep)
- 08:00 EU Flash Services PMI (Sep)
- 08:30 UK Public Borrowing (PSNB ex interventions) (Aug)
- 12:30 CA Retail Sales (Jul)
- 13:00 US FHFA House Price Index (Jul)
- 13:45 US Flash Manufacturing PMI (Sep)
- 14:00 EU Flash Composite PMI (Sep)
