We often have weeks with important data or key events for the markets, but rarely do we have something on the schedule that we know ahead of time is likely to show up in history books years from now. The Scotland independence referendum on Thursday is such an event. There were several polls out over the weekend, but they continue to be inconclusive – the result is really too close to call. Moreover, with the vote for this referendum extended to 16-year-olds from the usual voting age of 18, past performance is no guide to future performance. The results won’t be known until Friday morning.
A “yes” vote for independence would be cataclysmic. I expect that the impact on the pound would be swift and severe: a plunge towards the first support at 1.5725, and if that line didn’t hold – which it very well might not – a further drop towards the major support at 1.4815. The market is positioned for a “no” vote; Friday’s Commitment of Traders report showed that investors substantially increased their net long positions in GBP. Thus we can expect only a slight rebound on a “no” vote, probably back to the first major resistance around 1.6500, but a massive decline on a “yes” vote.
It’s my view that a “yes” vote would be a disaster for Scotland, for Britain and indeed for the Eurozone. But more of that tomorrow.
Also on Thursday we have the launch of the first targeted long-term refinancing operations (TLTRO) under the program that it announced in June. The TLTROs will provide banks with liquidity at the low fixed rate of 25bps for up to four years subject to banks meeting certain lending criteria. Banks may take up to a total of EUR 400bn, allocated in proportion to the size of their non-mortgage loan book, in the two initial TLTROs in September and December. The market will be watching to see how much is taken up and, over time, how it’s used.
Wednesday the Federal Open Market Committee (FOMC) ends its two-day meeting. The market will focus on two points. First, the Committee will update its forecasts, including the famous “dot plot” of its forecasts of the Fed Funds rate. Secondly, since March the statement following the meeting has reaffirmed the Committee’s intention to hold rates steady for a “considerable time” after it stops buying bonds, now on track to end in October. The market will want to see if they continue with this pledge. I expect that they will debate further the mechanics of raising rates, which are not so simple now that their bond portfolio is over USD 1tn, but make no changes in their description of the exit strategy yet. The improvement in the economy over the last three months means that they may raise their forecasts, including their Fed funds forecasts, which would probably be USD-positive.

Today: On Monday we have a relatively light day. Only Eurozone’s trade balance for July is due out during the European day.
In the US, industrial production for August is due out and the forecast is for the figure to decelerate. The Empire State manufacturing survey for September on the other hand is expected to show a slight increase.
Rest of the week: On Tuesday, RBA releases the minutes of its September meeting, when the RBA increased its protest against the high level of the currency and repeated its stance that AUD remains overvalued. From Germany we get the ZEW survey for September. The current and the expectation situation are expected to decline, reflecting worries about the impact of the Russian tit-for-tat sanctions. In the UK, the forecast for the August CPI is for the inflation rate to slow to 1.5%, a low level last seen in May and before that, in 2009. On Wednesday, Sweden’s Riksbank releases the minutes of its September policy meeting, when it held the repo rate unchanged despite the recent return of deflation to Sweden. In UK, the Bank of England releases the minutes of its latest policy meeting and it will be interesting to see if there were any more dissenting voters or if the two dissenters in July changed their stance given the increased uncertainty surrounding the Scottish referendum. The country’s unemployment rate for July is also coming out. In the US, the CPI for August is due out. On Thursday besides the Scottish referendum and the TLTROs, New Zealand’s Q2 GDP is to be released and the consensus is for a slowdown in the country’s growth. From Japan we get trade balance for August. In the UK, we get retail sales for August and from the US we get housing starts and building permits for August. Finally on Friday, the main indicator we get is Canada’s CPI for August.
The Market
Will EUR/USD challenge 1.3000?

EUR/USD moved somewhat higher on Friday, getting closer to the psychological barrier of 1.3000 (R1) and the lower boundary of the prior blue downside channel, connecting the highs and the lows on the daily chart. The MACD continued higher and seems ready to obtain a positive sign, while the RSI crossed above its 50 line. Having these signs in mind, I maintain my view that we may see the rate challenging the psychological line of 1.3000 (R1) as a resistance this time. Nevertheless, on the daily chart, the price structure remains lower highs and lower lows below both the 50- and the 200-day moving averages, thus I still see a negative overall picture and I would consider the recent advances as a corrective phase before sellers take control again. A clear move below 1.2860 (S1), is likely to trigger extensions towards the key support zone of 1.2760 (S2), defined by the lows of March and July 2013.
• Support: 1.2860 (S1), 1.2760 (S2), 1.2660 (S3).
• Resistance: 1.3000 (R1), 1.3100 (R2), 1.3160 (R3).
USD/JPY in a consolidative mode above 107.00

USD/JPY moved in a consolidative mode, maintaining its rate above the 107.00 (S1) barrier. I still expect the pair to extend higher and target the 108.00 (R1) line, defined by the highs of the 19th of September 2008. I will repeat that as long as the price is trading above the blue uptrend line and above both the moving averages, I consider the near-term bias to be to the upside. However, I would be mindful of a possible pullback before the next leg higher. The MACD has topped and moved below its signal line, while I see negative divergence between the RSI and the price action. In the bigger picture, I still see a newborn long-term uptrend, since, after the exit of a triangle, the price structure remains higher highs and higher lows above both the 50- and the 200-day moving averages.
• Support: 107.00 (S1), 105.70 (S2), 104.65 (S3).
• Resistance: 108.00 (R1), 109.00 (R2), 110.00 (R3).
GBP/USD stuck near the 1.6260 barrier

GBP/USD continued trading near the 1.6260 (R1) key line, remaining capped by the 50-period moving average. Taking into account that the price is trading below the blue downtrend line and below both the moving averages, the near-term technical picture remains negative in my view and I would consider the recent advance as a corrective move. Zooming on the 1-hour chart, I see negative divergence between the price action and both our hourly momentum studies, amplifying the case that the next leg could be to the downside. On the daily chart, as long as Cable is forming lower highs and lower lows below the 80-day exponential moving average, the longer-term trend remains to the downside in my opinion. Nevertheless, a few days ahead of the Scottish independence referendum I would prefer to take to the sidelines as the outcome could change the whole picture. I would like to take a view after the results.
• Support: 1.6070 (S1), 1.6000 (S2), 1.5870 (S3).
• Resistance: 1.6260 (R1), 1.6350 (R2), 1.6460 (R3).
Gold finds support at 1225

Gold continued declining on Friday, but the price triggered some buy orders near 1225 (S1) and rebounded to trade virtually unchanged. I still see a negative technical structure, but I would wait for a dip below 1220 (S2) before expecting the next leg lower. Such a move could pave the way for the critical obstacle of 1200 (S3). Shifting our attention to our momentum studies, the RSI exited its oversold field, while the MACD snows signs of bottoming and could cross above its trigger any time soon. Taking these momentum signs into account, I would be cautious about the continuation of the corrective move, perhaps to challenge the 1240 (R1) zone as a resistance, before the bears pull the trigger again.
• Support: 1225 (S1), 1220 (S2), 1200 (S3).
• Resistance: 1240 (R1), 1250 (R2), 1260 (R3).
WTI not choosing a direction

WTI declined on Friday after finding resistance below our 93.95 (R1) barrier. I would remain neutral for now, as the price oscillates between the aforementioned resistance and the support of 90.70 (S1). I would wait for a move below the psychological level of 90.00 (S2), before shifting my attention to the downside. Such a break is likely to trigger extensions to the 85.75 (S3) area, defined by the lows of the 18th of April 2013. On the other hand I will stick to the view that only a clear move above 93.95 (R1) could flip the bias to the upside, perhaps towards our next resistance at 96.00 (R2).
• Support: 90.70 (S1), 90.00 (S2), 85.75 (S3).
• Resistance: 93.95 (R1), 96.00 (R2), 96.70 (R3) .
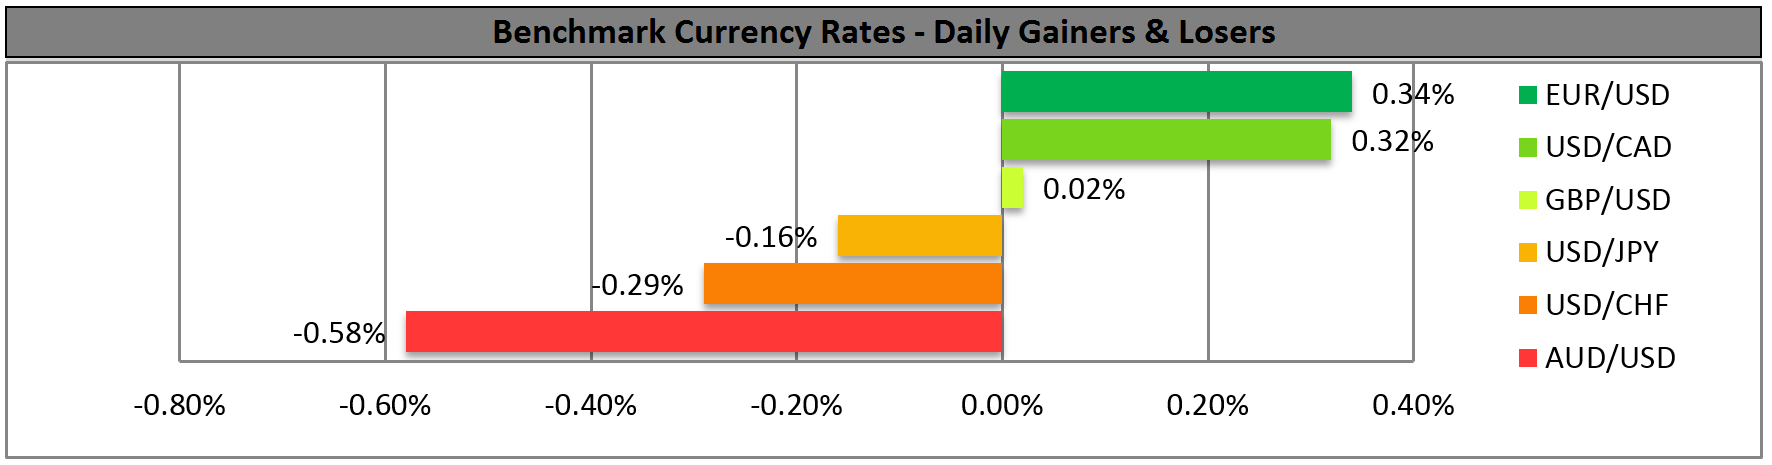
BENCHMARK CURRENCY RATES - DAILY GAINERS AND LOSERS
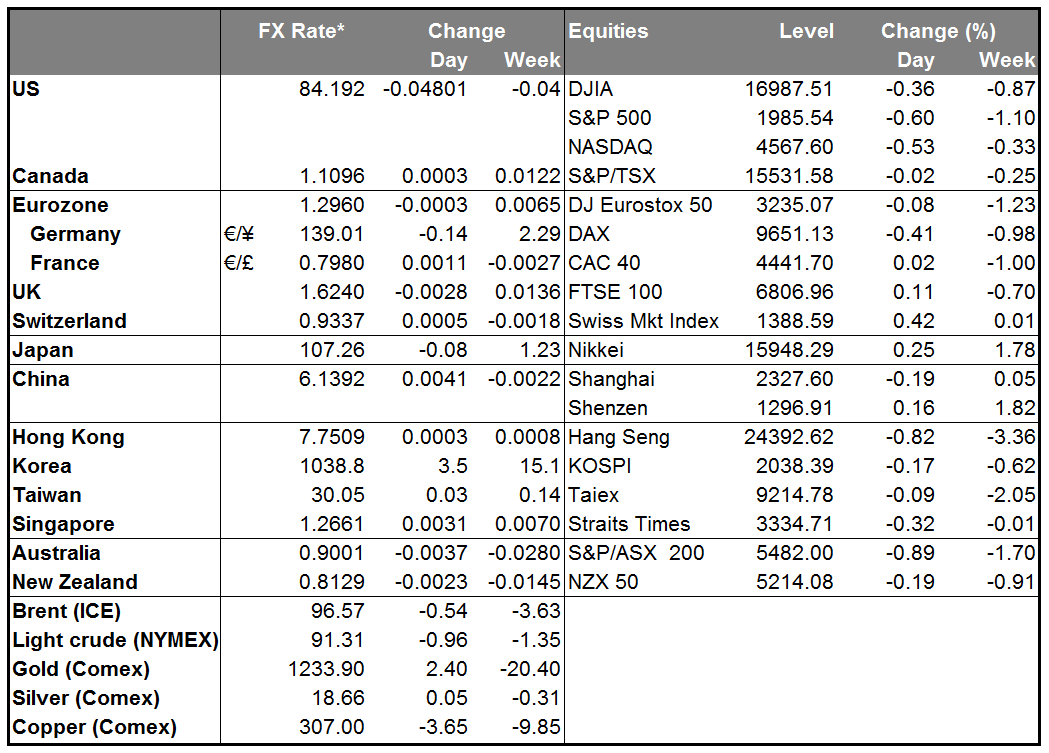
MARKETS SUMMARY