A week ago, I laid out a case for a tradable bottom in SPDR Gold Trust (NYSE:GLD) and iShares Silver Trust (NYSE:SLV). While both funds held up around 200-day moving average (DMA) support, speculators retreated further from net long positions in the latest CFTC data.
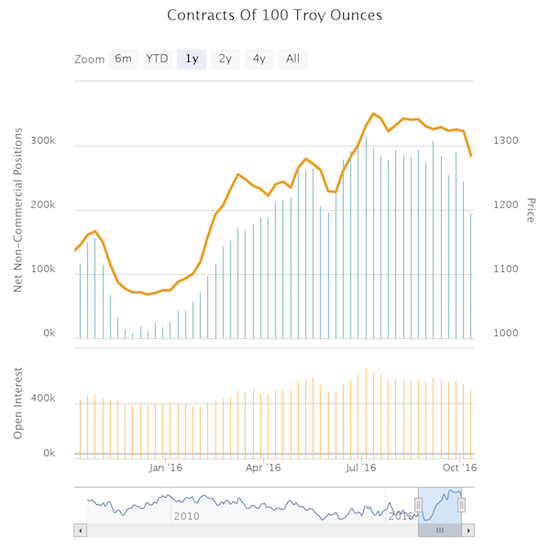
Gold speculators significantly reduced net longs positions for the second week in a row.
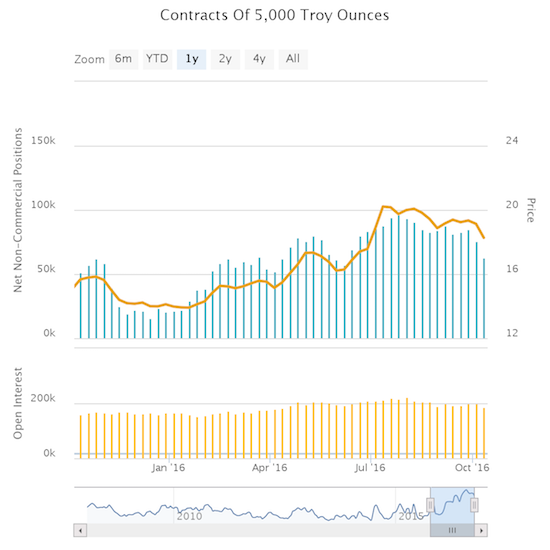
Silver speculators significantly reduced net longs positions for the second week in a row.
Net speculative longs in gold are back to levels last seen at the end of May. Net speculative longs in silver are back to levels last seen in early June. A more definitive downtrend appears to be developing as measured from the July highs. The charts above demonstrate the importance of tracking these speculative positions because both gold and silver peaked right around the time of the peak in net longs. If the retreat in positions continues from here, I fully expect GLD and SLV to give up 200DMA support.
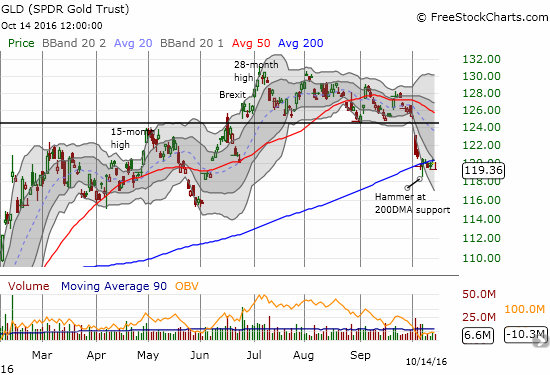
SPDR Gold Shares (GLD) churned all week below its 200DMA support. It ended the week at a marginally new 4-month low.
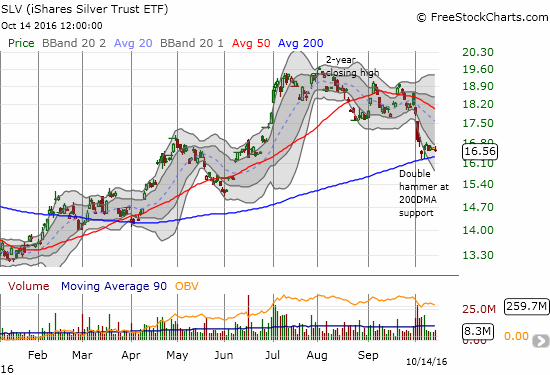
The iShares Silver Trust (SLV) churned all week as it remained aloft above 200DMA support.
Interest rates are part of the issue weighing down on gold. On Friday, iShares 20+ Year Treasury Bond (NASDAQ:TLT) broke its 200DMA support (lower TLT means higher bond yields). Notice how TLT peaked in July right alongside the peaks in GLD and SLV.
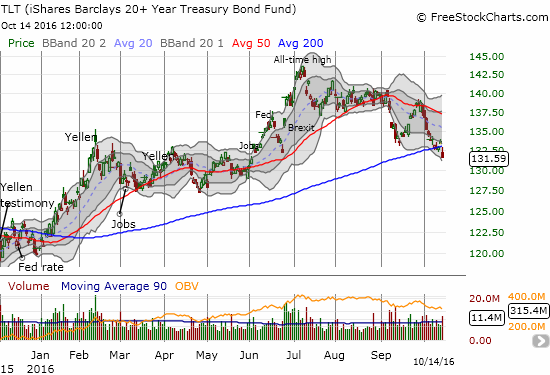
The iShares 20+ Year Treasury Bond (TLT) broke critical uptrend support at its 200DMA.
In my last post, I forgot to show a chart of the ratio of oil to gold. I think this is interesting because oil has sprung back to life at the same time support has eroded for gold. On a historical basis, oil has been trading quiet cheaply relative to gold. The current oil/gold ratio is back to the high for 2016. There is still quite some ways to go before even reaching the post-recession, fracking era midway point.
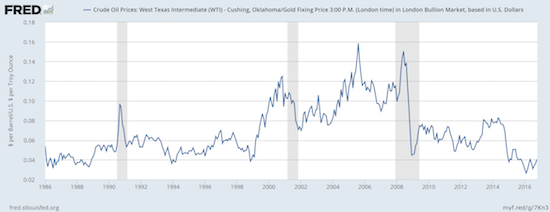
Is oil finally starting a long overdue comeback against gold?
I am also giving a special mention to VanEck Merk Gold Trust (NYSE:OUNZ). OUNZ is a gold ETF which allows investors the option of taking physical delivery of gold. For those who fear that GLD is just “paper gold” that will evaporate if the fund is called into account for its asset value, OUNZ may be a satisfactory alternative to buying gold bars directly.
The chart below shows that OUNZ essentially trades like GLD. This comparison means that, so far, investors and traders are not paying a premium (or discount) for the extra privilege of access to physical delivery.
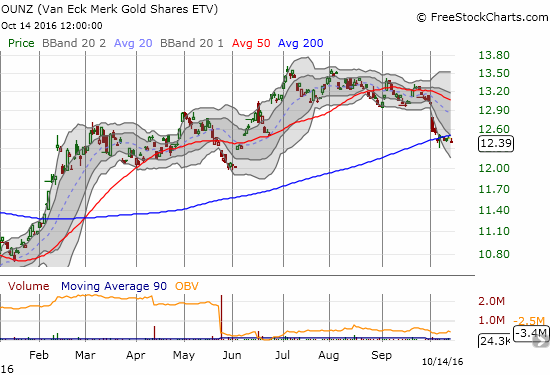
Like GLD, VanEck Merk Gold Trust (OUNZ) is struggling to hold onto 200DMA support.
Be careful out there!
Full disclosure: long GLD, long SLV shares and call options
