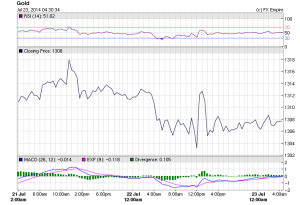
Gold is trading at 1307.90 this morning a bit stronger in the Asian market as traders bought up the cheaper commodity after its steady decline this week. Gold added $1.90 this morning while silver is down 21 points at 20.987 and Platinum moved with gold to add $1.70 to trade at 1491.80. Silver was steady in early Wednesday trade after dipping overnight, but looked likely to hold above $1,300 an ounce as geopolitical tensions from crises in Ukraine and the Gaza strip brought safe-haven bids. Tensions eased on Tuesday after a train carrying the remains of some of the victims arrived in Ukrainian government territory and separatist leaders gave Malaysian authorities the aircraft’s flight recorders.

SPDR Gold Trust (ARCA:GLD), the world’s largest gold-backed exchange-traded fund, said its holdings rose 1.5 tonnes to 804.84 tonnes yesterday. Gold is expected to drift lower in the last half of 2014 leading to a second annual decline in the average price as US monetary policy returns to normal and Asian demand weakens. Gold prices are expected to trade in the red today as its safe haven appeal has shifted to the US Dollar.
Base metals are trading on the down side this morning with Copper flat at 3.206. Broad fundamentals still suggest downside as we are seeing subdued demand from major consumer China. Yesterday updated Chinese exports of refined copper rose to the highest since March last year with a very small base. Exports rose as probe into warehousing at Qingdao Port undermines the appeal of holding inventories of the metal tied to financing.
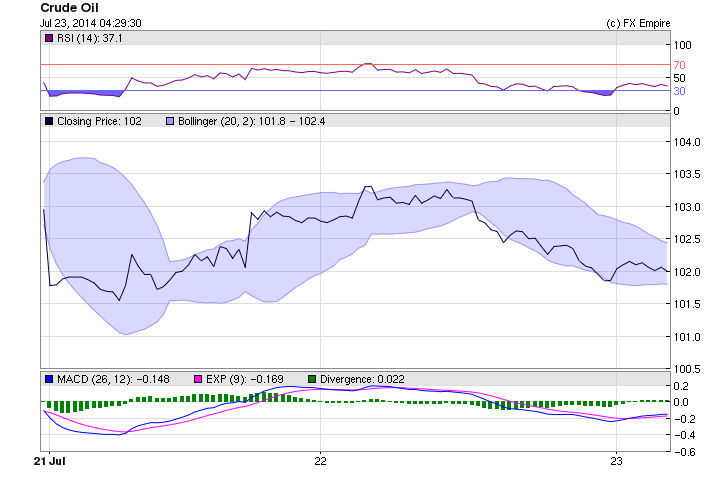
In a surprise divergence, gold eased, the US dollar gained and crude oil continued to climb. Crude normally will follow the track of gold during geopolitical tensions and as a rule when the US dollar climbs oil falls as it becomes more expensive to buy in US dollars. This morning Crude gave back 36 cents to trade at 102.03 but still remains well over its suggested and average trading range even as geopolitical turmoil moved back from the brink on Tuesday. Traders will be closely monitoring todays US inventory report. U.S. crude dropped to around $102 a barrel in early Asian trade this morning, falling for a second consecutive session with oil supplies unaffected by continuing violence in Iraq, Ukraine and Gaza. The American Petroleum Institute (API) data released on Tuesday showed that U.S. crude inventories fell 555,000 barrels last week to 374.7 million. In Libya, oil production had fallen to around 450,000 barrels per day (bpd) as of Monday compared with 555,000 bpd on Thursday. The drop comes as a twin suicide bombing at a Libyan army base in Benghazi killed at least four solders. The European Union threatened Russia on Tuesday with harsher sanctions over Ukraine that could inflict wider damage on its economy following the downing of a Malaysian airliner, but it delayed action for a few days. Brent Oil is flat this morning at 107.22

