“Perp Bond Thunder” is the new gold price driver in play, and it has the potential to influence major markets for many years into the future.
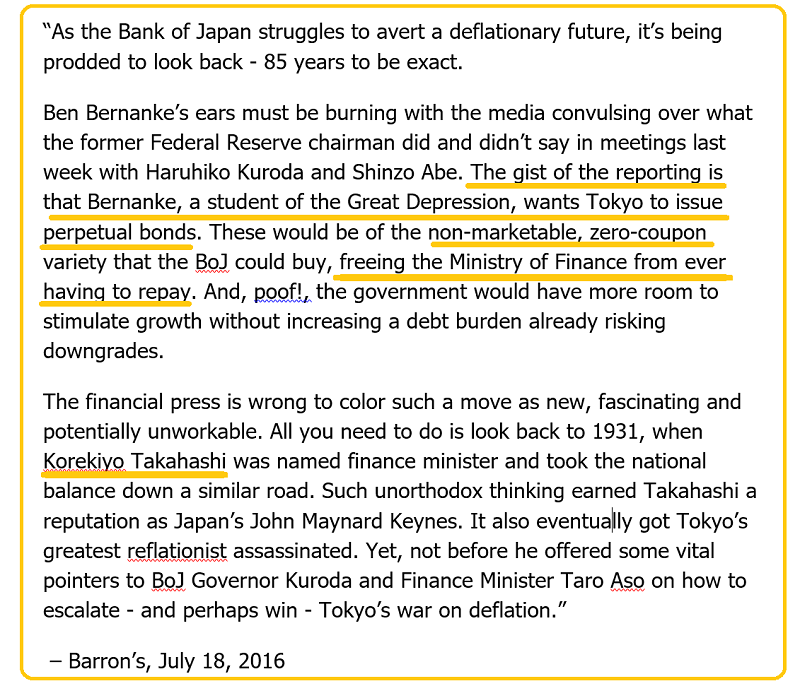
Japan may lead the world with a sizable launch of perpetual bonds that feature no interest rate and no maturity date.
Ben Bernanke is probably the biggest money printer in the history of America. He is now working hard to convince Japan to lead the world with a huge launch of perpetual bonds.
It’s a scheme to monetize the huge Japanese government deficit.
Perpetual bonds are known as “perps” amongst institutional money managers. If they are used in the manner suggested by Ben Bernanke and other top bank economists, they have the potential to allow Western governments to continue to operate huge fiscal deficits, with the only cost of running those deficits being the “minor inconvenience” of destroying the purchasing power of most fiat currencies.
It’s important that the entire gold community understands how the perpetual bonds scenario would likely affect the price of gold. In America, QE and low interest rates did little more than incentivize the US government to keep spending more money than it should.
Janet Yellen was forced to begin raising rates in an attempt to force the US government to reduce its size, and thus reduce its drag on the US economy.
Perpetual bond issuance allows central banks to keep rates low, and that keeps governments happy. The use of these bonds also dramatically reduces system risk, because governments don’t hit a spending limit wall.
In my professional opinion, global governments can probably happily borrow and spend money they don’t have for another ten to twenty years, and the only cost will be steadily rising inflation.
I realize that many gold analysts picture a “day of reckoning” for governments that send gold on a parabolic trajectory like in the 1970s, but I would suggest that the next several decades are going to feature a modest but relentless rise in the price of gold.
Perpetual bond issuance also puts the need for gold revaluation on the backburner. Revaluation would be required only once most government deficits are fully monetized with the perpetual bonds.
At that point, the global financial system could be reset with a global central bank and currency. Gold would be a key part of that global currency, along with leading national fiat currencies.
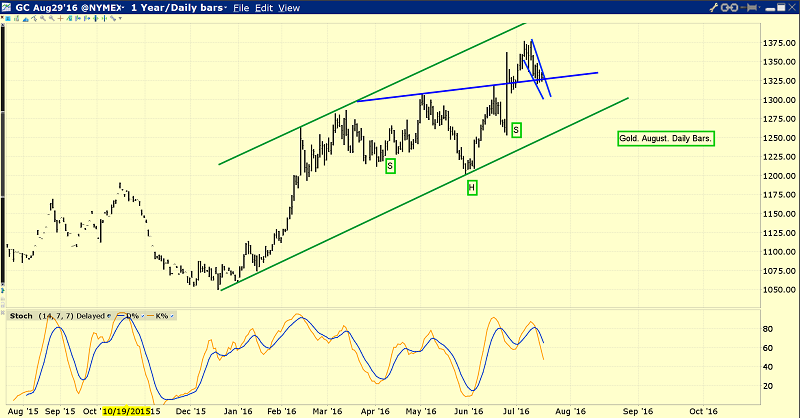
This is the daily gold chart. In the short term, gold is well supported here, but upside action is likely to be limited.
There is a small bull wedge pattern in play, and that follows an inverse head and shoulders bull continuation pattern upside breakout. The chart looks good, but it will take time for perpetual bonds to become the next big price driver, and most other news is already priced into the market.
The summer stock market rally is not causing institutional investors to sell gold to buy the stock market, but it has created a pause in their allocation of new money to gold. As a result, gold is essentially meandering sideways without real price direction.
I’ll dare to suggest this is the greatest time in history to own gold, and not because it is going “vastly higher”. It’s because gold now has more institutional respect than it has in decades.
Investors who were perhaps overly obsessed with gold having “one more trip down” in December of 2015 may now be waiting for a price correction to rebuy what they sold during 2014-2015.
I think that’s a mistake. Gold is not likely to rise much for the rest of the year, but it’s not likely to fall much either.
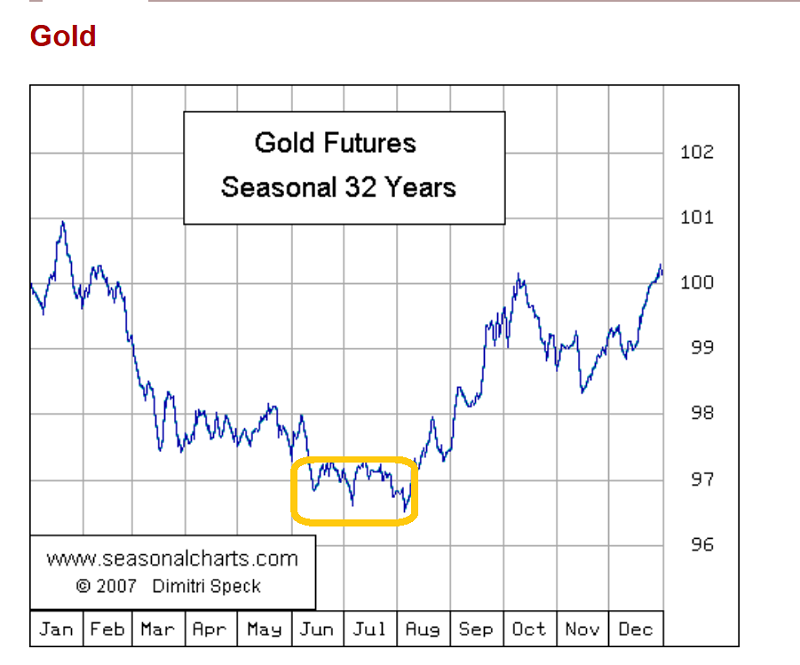
That’s a seasonal chart for gold. The price action is typically pretty boring in July, but that doesn’t mean that investors have to be bored!
When sideways price action becomes the dominant market theme, short term trading can be highly rewarding, with very modest risk.
Eager traders can buy small amounts of gold on ten dollar dips, and sell it on twenty to thirty dollar rallies, while working in the garden or mowing the lawn!
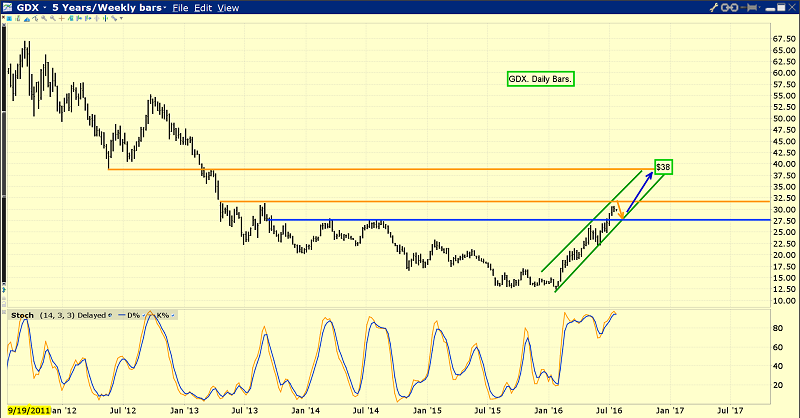
This is the important VanEck Vectors Gold Miners (NYSE:GDX) weekly chart. Even with gold potentially trading sideways for a few months, many gold stocks will continue to stage remarkable gains.
GDX can rise to as high as $38 in the intermediate term, and all $2 to $3 dips need to be bought by gold stock enthusiasts.
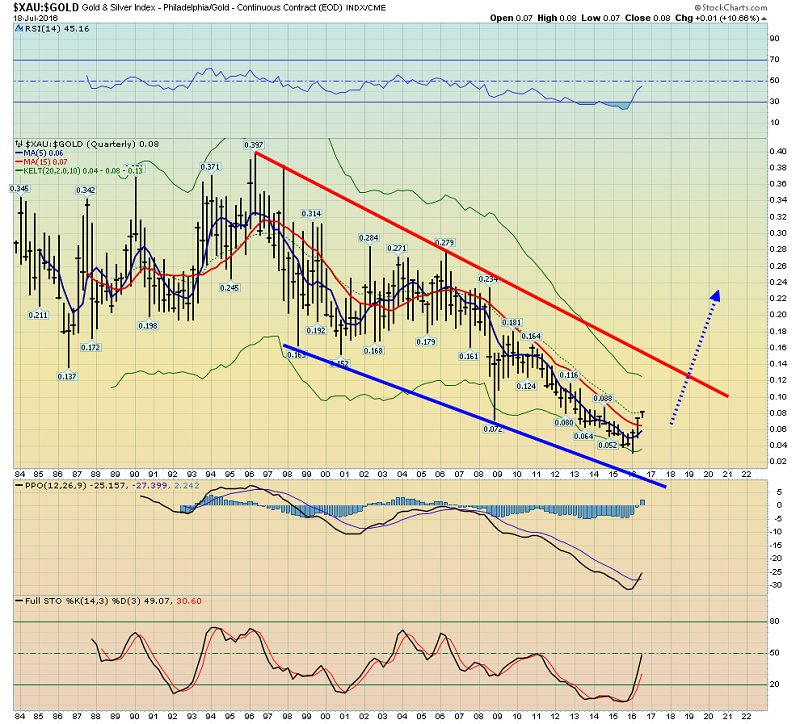
This is probably the most important chart for any gold stock investor to follow. It’s the quarterly bars chart of the XAU gold stocks index compared to the price of gold. Gold stocks have been in what is roughly a twenty-year bear cycle against gold, and I’m adamant that the rise of the “perpetual bonds era” is going to see gold stocks outperform all the world’s asset classes for the next several decades.
It’s far more important to buy gold stock price dips than corrections, given the dramatic upside potential versus the modest downside risk! For gold stock investors, happy times are not just here, but here to stay.
Risks, Disclaimers, Legal: Stewart Thomson is no longer an investment advisor. The information provided by Stewart and Graceland Updates is for general information purposes only. Before taking any action on any investment, it is imperative that you consult with multiple properly licensed, experienced and qualified investment advisors and get numerous opinions before taking any action. Your minimum risk on any investment in the world is: 100% loss of all your money. You may be taking or preparing to take leveraged positions in investments and not know it, exposing yourself to unlimited risks. This is highly concerning if you are an investor in any derivatives products. There is an approx $700 trillion OTC Derivatives Iceberg with a tiny portion written off officially. The bottom line: Are You Prepared?
