Precious Metals have had an interesting week. Both silver and the gold stocks rebounded off their 50-day moving averages only to do a 180 the following day. Meanwhile gold has given back most of its January gains. In this missive we consider the near term outlook for gold and the gold stocks.
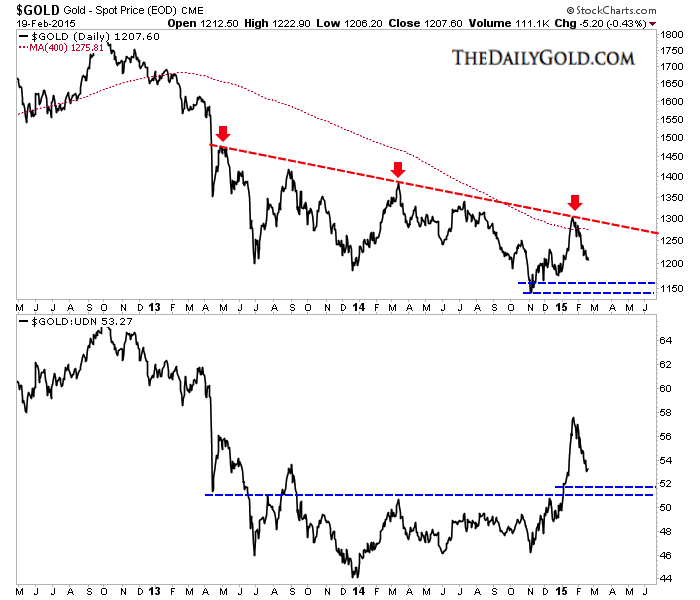
In the chart below we plot gold and gold priced in foreign currencies (Gold/FC) which is essentially the inverse of the US dollar Index. Gold put in a strong rebound, rallying over $150/oz from November through January. That was also its strongest rally in real terms in several years. As we can see, Gold/FC drove that rally as its driving the current decline (to some degree). gold/FC has a bit more downside to go to reach support. The fact that gold could not hold above $1240 tells us that Gold will need more time before it can retest trendline resistance. However, gold’s strength against foreign currencies is a major character change that wasn’t in place during 2013-2014.
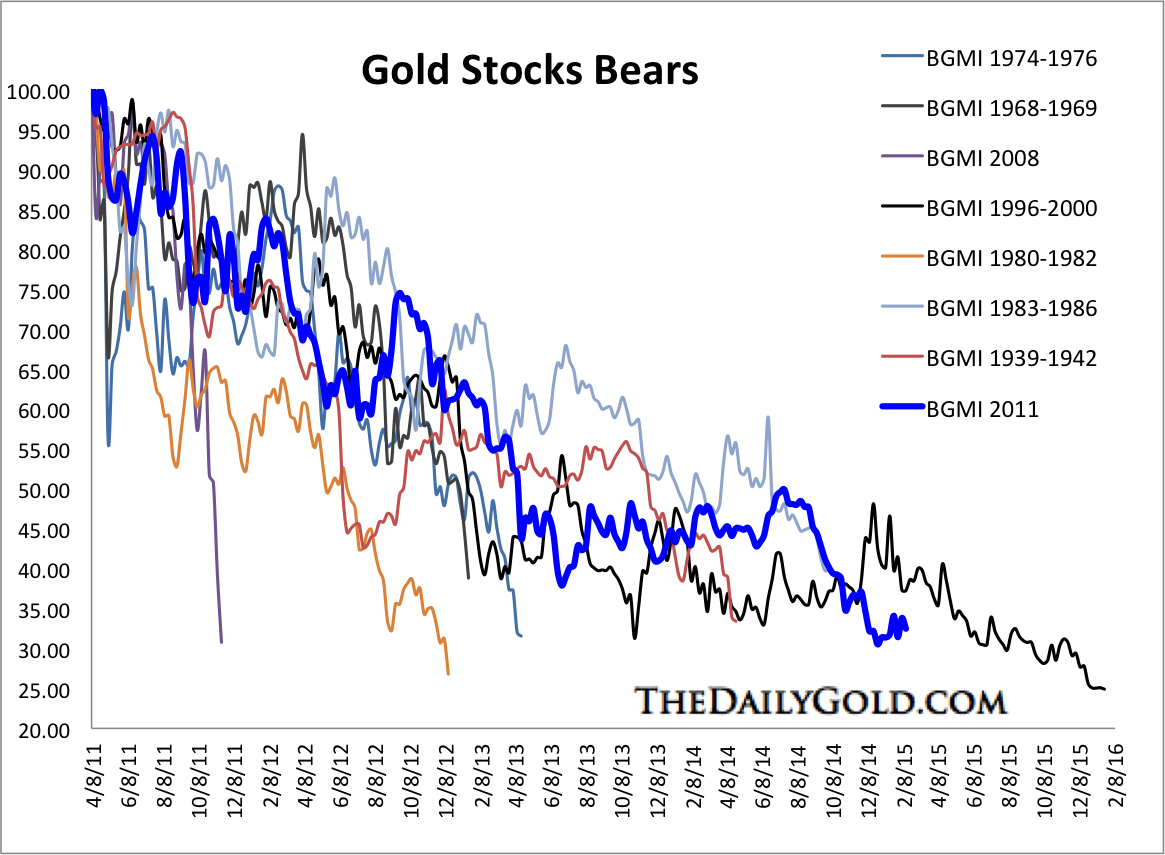
Turning to the stocks, let’s start with the bears analog chart. We use weekly data from the Barron’s Gold Mining Index which dates back to 1938. Back in December we noted that gold stocks were likely at their second most oversold point in history. The most oversold point was the months and weeks prior to the bottom in 2000. Markets can do anything in the short term but this chart makes a strong case that miners are extremely ripe for a new bull market.
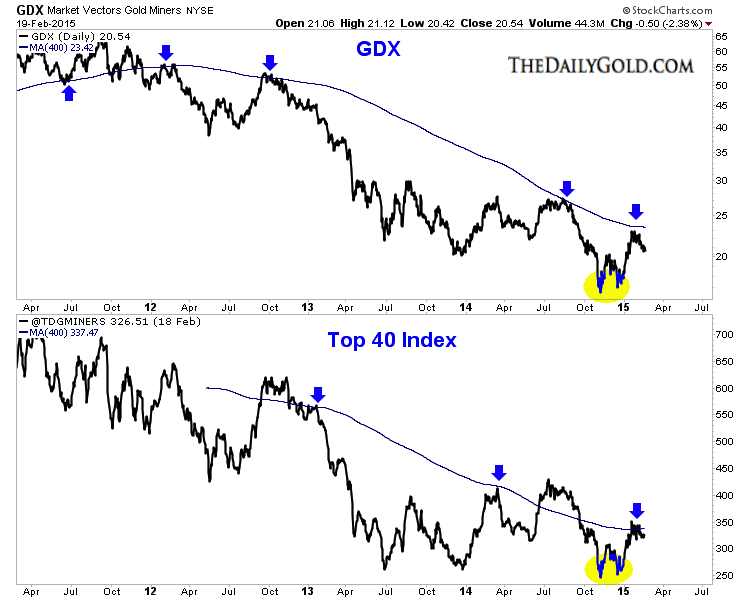
Next is a chart of GDX and our Top 40 Index. Both formed a strong double bottom at the end of 2014 and both will need to surpass their 400-day moving averages to be in a new bull market. The miners formed the recent low amid an extremely oversold condition. After a strong rebound, resistance has come into play. The range between strong support and strong resistance is getting smaller.
The trend for precious metals can be considered neutral or range-bound with a current bearish bias. After strong rebounds, Gold and gold shares are backing off from resistance. They aren’t yet ready to make major breakouts to lift them into bull markets.
This is bearish but there have been key bullish developments in recent months which should caution bears. Both Gold and gold shares performed well amid a very strong US dollar which signals a major change. Gold companies are benefitting from the collapse in energy prices and weak currencies within the jurisdictions they operate.
Because gold companies can benefit from lower energy costs and weaker foreign currencies, it’s quite possible that they could be the first, ahead of gold to break into new bull market territory. Market heavyweights such as Jeff Gundlach and Jim Rogers may sense that as they recently became investors in the miners. A new bull market lies ahead sooner rather than later but investors and traders need to maintain their discipline and patience.


