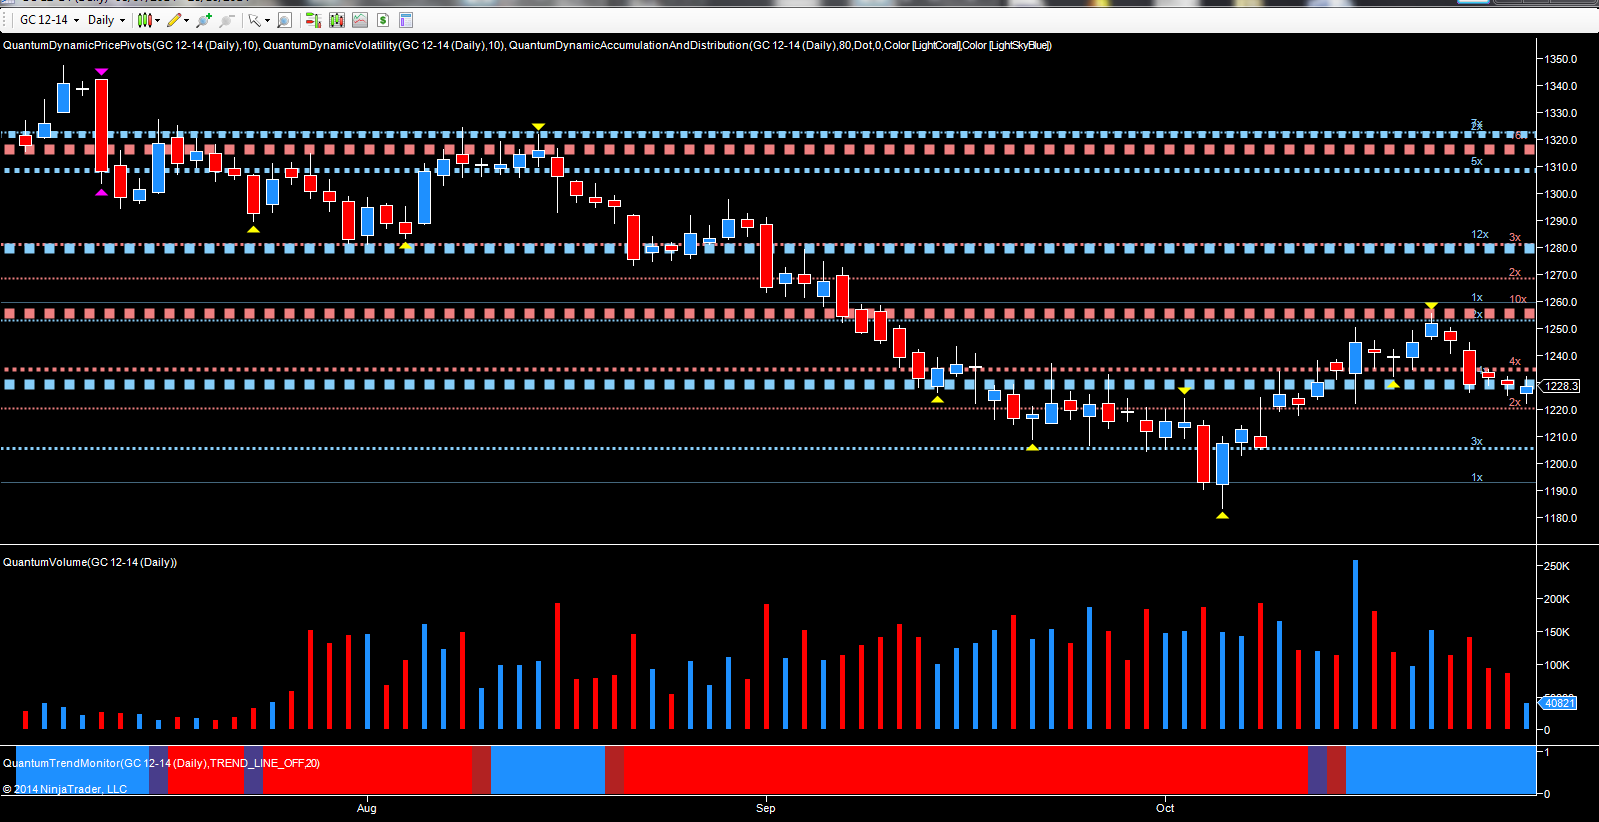
For Gold, October could best be described as a game of two halves, with the rally during the early part of the month now appearing to have run out to steam as the longer term bearish sentiment begins to dominate once more. For gold bugs it’s a rally that has promised much but delivered little, with the precious metal now breaking through a key potential support level in early trading this morning on the electronic market.
The key day of price action for October occurred at the mid-point on the 15th, with the price action of the day closing with a relatively narrow spread candle, but with wicks to both top and bottom defining the volatile moves intraday. The trading day saw gold hit a high of $1250.30 per ounce and a low of $1220 per ounce, before closing the session at $1244.80 per ounce.
However, it was the volume which provided the key signal, and with such extreme volume on the day, coupled with the associated price action, this delivered the first sign of a potential reversal. The deep resistance zone in the $1255 per ounce ahead duly capped any further move higher, with the price action of the 20th October, confirming this initial weakness, with a narrow spread up candle and high volume, topped with a pivot high.
Subsequent days then saw gold move lower on rising volumes before finally pausing in the $1230 per ounce area, and testing the potential platform of support in this region, denoted by the blue dotted line. In early trading this morning, gold has continued through this region to trade at $1228 per ounce at time of writing.
However, should we see a close below this key level, this will confirm the bearish picture, with a move back to test the secondary support region at $1205 per ounce. Should this be breached, then gold is likely to move back below $1200 per ounce once more, and down to re-test the low of early October in the $1183 per ounce region.
From a fundamental perspective, this week’s FOMC meeting could also help to drive the price of gold lower, particularly if there are any firm hints as to when interest rates are likely to rise. At present, the indications are for a move in 2015. Should there be any hint of a ‘sooner rather than later’ view, then this could be the trigger for a further sell-off in gold. With inflation a dim and distant prospect, and risk-on sentiment now dominating, the outlook for gold remains weak in the short to medium term.
Finally, gold bugs will be watching the forthcoming Swiss referendum, which is due on the 30th November, closely, as any yes vote will then force the Swiss National Bank to enter the physical gold market and buy over 600 billion dollars of gold in the spot market. With current reserves at 7%-8% according the World Gold Council statistics, and with the referendum then forcing the SNB (if a yes vote occurs) to increase this to 20%, this in turn would then equate to the bank buying a further 1500 tonnes of gold in the open market.
If this occurs, it is the first step towards the monetization of gold, and a move away from fiat money. The 1st December could indeed be a seminal one for gold traders (along with the rest of the financial markets)!
