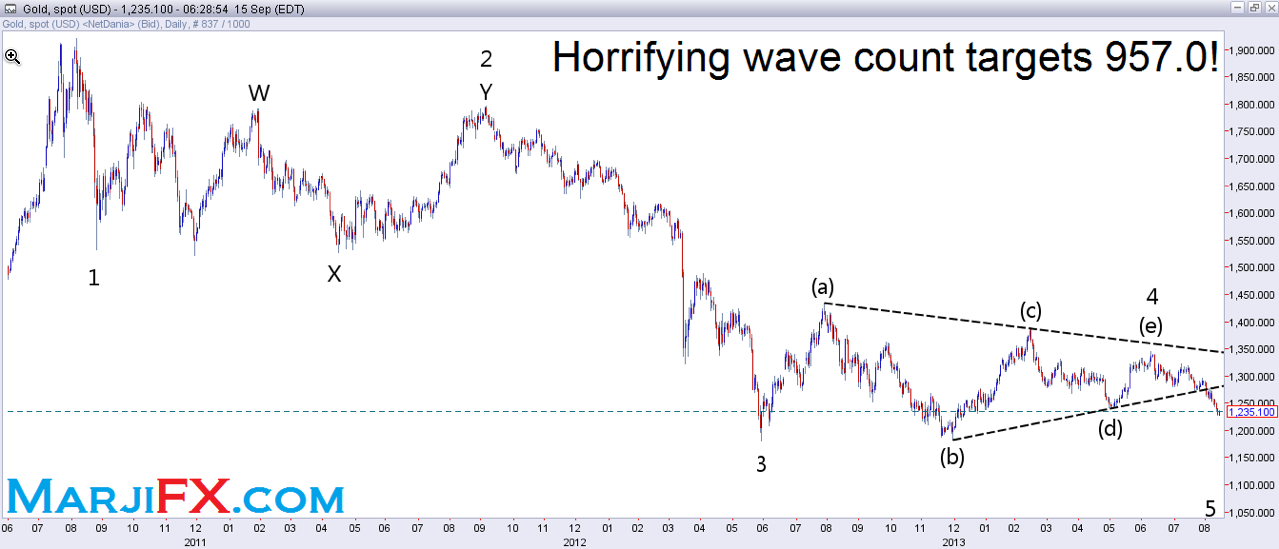
When Gold broke below its June-1st bottom 1240.5, things completely changed because that break meant that we can no longer consider the falling move from July’s top -- 1345.4 -- a correction for the previous move. The break forced a visit to the longer-term charts and what can be found there is horrifying for the precious metal.
In the chart below, I attempted to count the waves from the historical high of 2011. Although wave 2 looks extremely complicated, the rest of the waves look very good. Now, if we can get past the complexity of wave 2 and the chaos inside its internal structure, we see a seriously bearish wave count. Personally, I have seen waves 2, 4 and B create absolute chaos and, therefore, I have become more tolerant with the internal structure of those waves.
Part Of A Triangle
If this wave count is correct, then every move from last year’s 3-year low of 1180.4 is a part of a triangle. The internal structure of waves a, b and d in specific is in complete harmony with the requirement that the waves within triangles come in threes. Nevertheless, the structure of waves b and e is not as satisfying.
This frightening wave count suggests that July-10's top of 1345.4 is the end of wave e and, therefore, the end of the triangle. The inescapable conclusion of this observation is that the drop from the above-mentioned top is wave 5, which is expected to dive below the extreme of wave 3, which is 1180.4. One important guideline of The Wave Principle is the equality guideline, which suggests that some waves tend to be equal to each other, including waves 1 and 5. If we use this guideline to calculate the potential target of wave 5, we will have a shocking target at 957.0.
The last time gold traded below $1,000 was in September 2009, and we could be trading below this landmark at a later time this year, or early next year. However, before we commit to this startling outlook, a search for more clues is needed.
The Short Term
The recovery from the Asian session’s 8-month low has touched the falling trend line from September 8th high, and price is currently running just below this line. Therefore, first resistance is at the current daily high 1236.4. A break above this level would confirm that we have seen an important short term bottom at the Asian session’s low. If this break actually happens, the price will be expected to target 1243.6 and 1247.2 ahead of the short-term retracement levels, which start at 1252.7, and include 1261.1, 1269.5 and 1276.3.
However, stopping very close to a falling trend line is not a bullish sign at all. Unless the price breaks above this trend line soon, another retreat will be expected. The second sign that such a retreat is becoming probable is breaking below the European session’s low 1234.3 and a new multi-month low will become probable if we break below the micro term Fibonacci 61.8% at 1229.8. Probable targets below today’s current low (1225.7) include 1224.6, 1218.5 and 1211.6. Those are all short term target, but the medium term target of breaking below 1240.5 is to at least test 2013 3-year low 1180.4, if not break below it.

