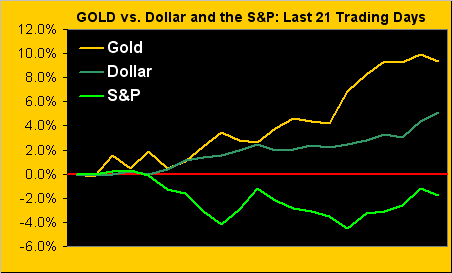
Some of you might think that Gold has already passed its first big test in 2015 by price being up better than 9% in this young year, despite the dollar's rising as well. But regular readers know such positive correlation with the Buck is not a big deal for us, our having demonstrated time and again in these updates that Gold plays no currency favourites.
Moreover, last April we wrote a Gold Update similarly entitled "Gold's First Big Test In 2014": 'twas just before StateSide Tax Day, which a year prior in 2013 infamously marked the unrelenting unraveling of Gold's price from the 1600s down into the 1100s in just over 11 weeks. So 'twas with a high degree of "repeat sensitivity" to such 2013 event that we then penned that piece some nine months ago, at which time Gold's price was 1318 (and its weekly parabolic trend then Short). Today, Gold's price is not much different at 1294, (but its weekly parabolic trend now Long). Yet this year, we see Gold's true first test arriving far sooner. For whilst price is nicely higher year-to-date, here's the party-pooper: we arrived back at the Whiny 1290s.
Let's first put the current 1294 price of Gold in context. As we've noted in recent missives, recall that were Gold to put in a millennium-to-date "average" performance for this year, 'twould finish 2015 at a price of 1329 (+12%): this past week alone, 1307 -- just 22 points short of that "average" year-end calculation -- has already been achieved. Or instead, were Gold to match the millennium's best performing year (2007, +31%), 'twould finish 2015 at a price of 1554. To achieve the latter percentage increase would clearly be nothing short of impressive, and yet the 1500s somehow seem small given the above Scoreboard's calculation of price "ought" being at 2468 today, (or 108% above 2014's closing price of 1183). To effect that doubling of price would require some massive catalyst, (such as the inevitable realization that Gold actually is money after all). Whilst that is "the then", let us turn our focus to "the now" and why Gold is up against its first big test in 2015.
Now don't get whiny, for as noted, Gold returned this past week back up into the 1290s, even teasing the low 1300s. But remember how annoying the Whiny 1290s were through many-a-month last year? We couldn't escape 'em, their at times compressing our expected daily trading range ("EDTR") measure to only 12 points, (today 'tis 23 points). Not being able to escape the 1290s for weeks on end made so many of us whiny: 'twas like a bad dream of being stuck in an endless loop on Mr. Toad's Wild Ride at Disneyland, never to again see the light of day whilst growing ever-more queasy. And thus as we go to Gold's year-over-year weekly bars, those that traced any portion of the Whiny 1290s have been adorned with appropriately-coloured squares, indicative of just how nauseatingly yucky (technical terminology) we've all found this area to be, inclusive of the rightmost new bar:
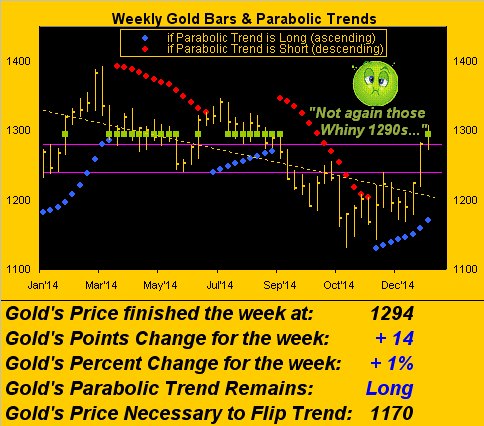
Therefore, we view this as Gold's first big test in 2015: to not get stuck all over again in the Whiny 1290s, but rather to move up into higher ground, say to "Base Camp 1377". With respect to the above chart, the good news is Gold's parabolic trend remains well-Long, and further that price quite swiftly moved up through the 1240-1280 purple-bounded resistance zone. The bad news is this combination of Gold's having almost already reached what its closing price would be for an "average" up year and the potential of getting mired yet again in these Whiny 1290s, (with the purple 1280-1240 zone hopefully at least now morphing into support such that the 1100s become but a distant memory).
Notwithstanding the capacity for Gold's getting stuck here in the Whiny 1290s as it did far too often last year, this time "'tis different". Take into account such issues as the European Central Bank's brand new €1 trillion debasement program, (which for you WestPalmBeachers down there means another $1.2 trillion worth of foundationless currency units being added to the global money supply); the Swiss National Bank having seen that writing on the wall by removing its cap in eulogy to the €uro; and a stock market in the whipping death throes of agony, failing to come to grips with an earnings base just half of what it ought be, FedSpeak of rates being nicked up, and a StateSide economy joining those of the rest of the world in losing its grippity.
"But, mmb, they say on TV every day just how strong our economy is!"
Ah, Squire, 'tis yet another example of the incessant parroting of that which therefore must be true, although credit is due the IMF in cutting its global economic growth outlook for this year, save for the "Part-Time Jobs 'R' US" (pun intended). But by our measuring, here's the honest run of the numbers:
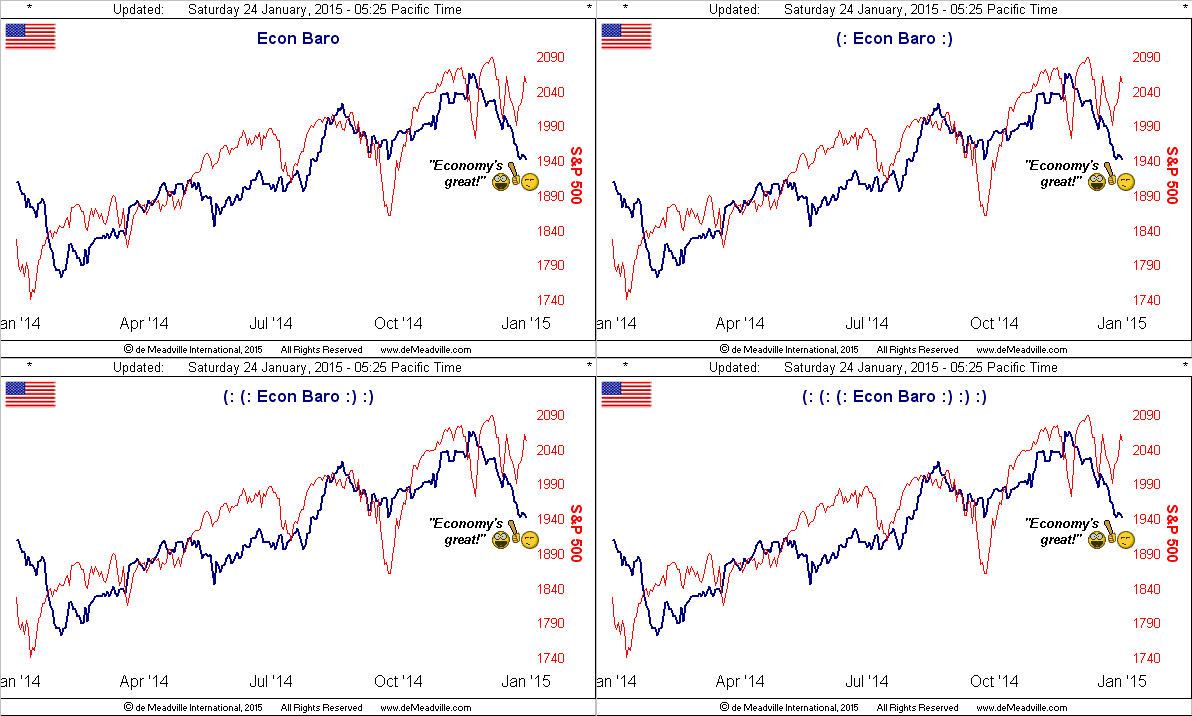
Something else that's different this time 'round is, as noted at the outset, Gold's not succumbing to "dollar strength". And isn't it just amazing how FinMedia perceptions change? We were regularly informed last year that "dollar strength" was hurting Gold. This year we're regularly informed that "€uro weakness" is helping Gold. 180° out of phase! Truth be told, 'tis currency creation regardless of nation that is the ultimate booster of Gold. Credit, too, John Plender over at the FinTimes in noting this past week that:
"(Gold is) a hedge against central bank incompetence and monetary dysfunction, which includes deflation. There is no opportunity cost in holding gold when interest rates are below zero."
And borne of deflation is eventual inflation. Either way, for the present, here are the percentage increases from one month-ago-to-date for Gold, the dollar Index, and the S&P 500:
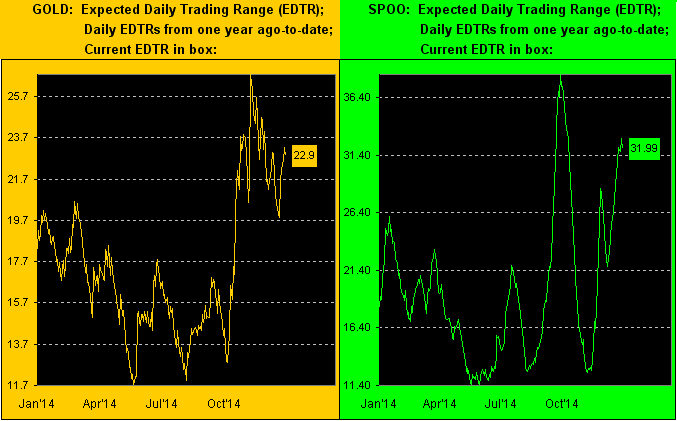
Another difference we've been enduring, certainly since last October, is the marked increase in trading volatility, as displayed in this two-panel graphic for year-over-year readings of EDTR. For Gold on the left, its EDTR a year ago was 19 points; today 'tis 23 points, not really an alarming increase. But for the S&P on the right, the EDTR being 18 points a year ago has ramped up to 32 points (yikes!):
Staying with these same two markets, lets now shift from volatility to the following three-month views of trend. For Gold on the left, the baby blue dots, indicative of 21-day linear regression trend consistency, are beautifully flowing in their production of both higher lows and higher highs. But on the right for the S&P, 'tis gone from an environment rife with spa-like "it will never go down" copacetic complacency to a market that is downright dangerous: look at the abrupt changes and steepness of the S&P's swings, which in turn have thrown the "Baby Blues" into a pattern of essentially useless oblivion (more yikes!):
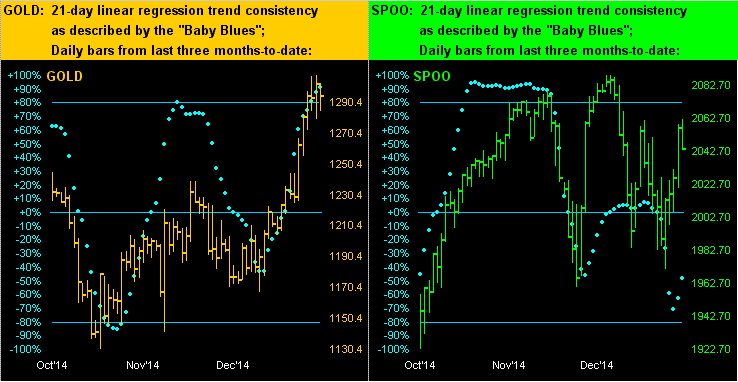
In fact, through the magic of computing search functionality, 'twas back in the 09 November 2013 edition of The Gold Update that we initially began anticipating a crash of the S&P, (that Index today at 2052 being 16% higher then 'twas then at 1771). As the S&P has since continued to rise without the associated support of earnings, we've oft proffered the notion of being "on crash watch". Now we've more the sense of being "on crash warning". Or put another way, if ever there was year for opting to hang onto one's dough rather than attempting to grow it via equities, (ex-maintaining a position in Gold), this is it! Just sayin'...
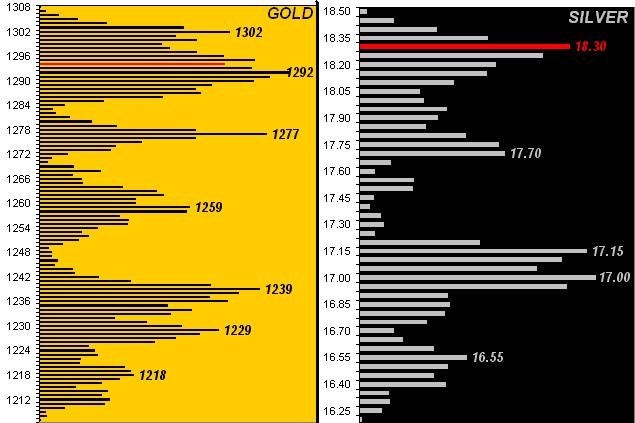
Here are the current 10-day Market Profiles for both Gold (left) and Silver (right). The horizontal length of each price bar reflects the volume of contracts therein traded, the labeled apices representing support/resistance levels. The respective red bars reflect the most recent session's (Friday's) closing prices for both markets:
The bottom line: In a few week's time, shall we be able to state that Gold indeed passed its first big test in 2015? To by then have moved up and beyond the suffocating clutches of the Whiny 1290s will justify a resounding "YES!", with an above-average year expectantly in the balance. But between now and then, trading influences abound. In just the ensuing week alone we've got the Parliamentary elections in Greece (tomorrow/Sunday) toward selecting a new President; Wednesday brings the Federal Open Market Committee's policy decision on rates (sans Chair Yellen Press Conference); and then come Friday is our first peek at Q4 Gross Domestic Product. May the volatility continue!
We'll close it here with this note on comparative pricing. In a world where concerns over deflation are running seemingly everywhere from economies to the price of Oil to NFL footballs, there remains in the world a pocket of what at least "feels" like inflation. And 'tis not in the new stadium built well to the south of here for the Santa Clara 49ers, wherein an ice-cream cone costs $8 and a hot dog $13. Rather 'tis in Schweiz where purportedly at the Steigenberger Grandhotel Belvédère Davos, the going hot dog price runs at the Swiss Franc equivalent of some $43, (albeit that includes mustard, pickles and onions). But the Swiss do have the 49ers' locale beat on a better beer price: $7 for a glass in the Alps vs. $11 for a plastic cup at the stadium. However: given that Gold is good at any price, so must be liquid Gold!