Get 40% Off
🚨 Volatile Markets? Find Hidden Gems for Serious OutperformanceFind Stocks Now

Global PEs And Price-To-Book Valuations; Bubble Debate Revisited

Published 10/08/2015, 01:22 AM
Updated 07/09/2023, 06:31 AM

Forward PE Estimates

Forward PE Estimates

I don't have any faith in forward PE estimates. They tend to be overly optimist and subject to numerous "one-time" writeoffs.

Instead, I recommend watching 10-year smoothed PE ratios. See discussion below.

Nonetheless, please note that even on a forward-basis, the S&P 500 ratio is well above most other markets.

Price to Book Valuations

Price to Book Valuations

On a price-to-book basis, US equities are twice as expensive as numerous other markets.

Case-Shiller Smoothed PE

The Case-Shiller PE is a Cyclically Adjusted Price-to-Earnings ratio, commonly known as CAPE, Shiller P/E, or P/E 10 ratio.

To calculate "CAPE," you divide the current price by the inflation-adjusted average of the last ten years of earnings.

Here is a link to the Current Shiller PE, updated daily. A better-looking chart is shown below.

Bubble Debate Revisited

Doug Short at Advisor Perspectives does periodic updates to the Shiller PE. His latest was on October 1 in Is the Stock Market Cheap?

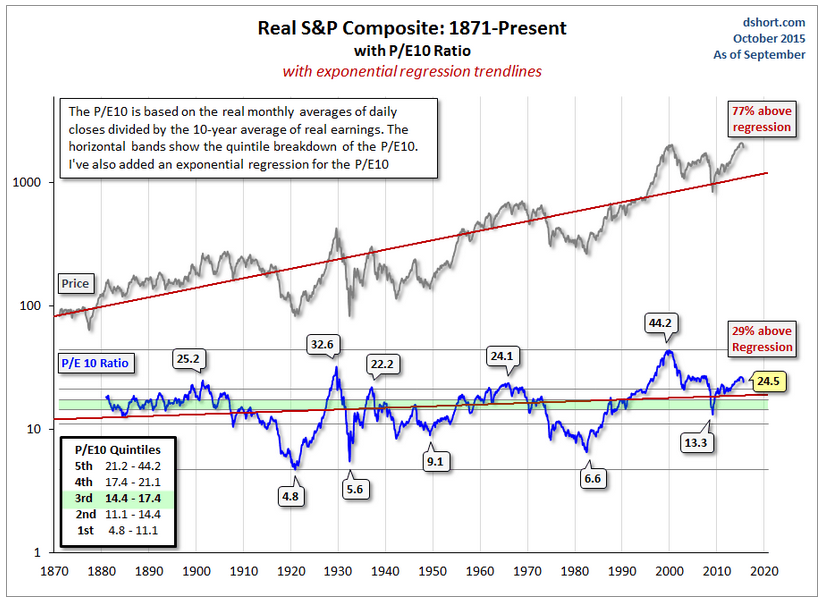
S&P Composite Chart

On a PE/10 basis, stocks are in the fifth quintile range, signalling extreme overvaluation. Higher smoothed PEs happened in 1929, the dot-com bubble, 1902, and earlier this year.

The historic P/E10 average is 16.6. After dropping to 13.3 in March 2009, the ratio rebounded to an interim high of 23.5 in February of 2011 and then hovered in the 20-to-21 range. It began rising again in late 2013 and hit a new interim high of 27 in February of this year. It has now dropped below that high.

Of course, the historic P/E10 has never flat-lined on the average. On the contrary, over the long haul it swings dramatically between the over- and under-valued ranges. If we look at the major peaks and troughs in the P/E10, we see that the high during the Tech Bubble was the all-time high above 44 in December 1999. The 1929 high of 32.6 comes in at a distant second. The secular bottoms in 1921, 1932, 1942 and 1982 saw P/E10 ratios in the single digits.

3rd party Ad. Not an offer or recommendation by Investing.com. See disclosure here or remove ads .

Latest comments

Risk Disclosure: Trading in financial instruments and/or cryptocurrencies involves high risks including the risk of losing some, or all, of your investment amount, and may not be suitable for all investors. Prices of cryptocurrencies are extremely volatile and may be affected by external factors such as financial, regulatory or political events. Trading on margin increases the financial risks.
Before deciding to trade in financial instrument or cryptocurrencies you should be fully informed of the risks and costs associated with trading the financial markets, carefully consider your investment objectives, level of experience, and risk appetite, and seek professional advice where needed.
Fusion Media would like to remind you that the data contained in this website is not necessarily real-time nor accurate. The data and prices on the website are not necessarily provided by any market or exchange, but may be provided by market makers, and so prices may not be accurate and may differ from the actual price at any given market, meaning prices are indicative and not appropriate for trading purposes. Fusion Media and any provider of the data contained in this website will not accept liability for any loss or damage as a result of your trading, or your reliance on the information contained within this website.
It is prohibited to use, store, reproduce, display, modify, transmit or distribute the data contained in this website without the explicit prior written permission of Fusion Media and/or the data provider. All intellectual property rights are reserved by the providers and/or the exchange providing the data contained in this website.
Fusion Media may be compensated by the advertisers that appear on the website, based on your interaction with the advertisements or advertisers.
© 2007-2024 - Fusion Media Limited. All Rights Reserved.