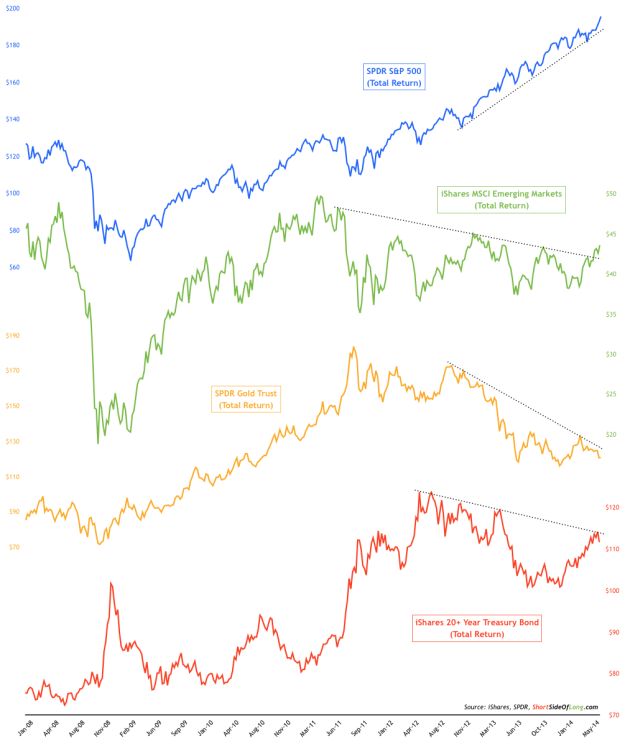
Chart 1: US equities (SPDR S&P 500 (ARCA:SPY)) have outperformed Bonds (iShares Barclays 20+ Year Treasury (ARCA:TLT)), Gold (SPDR Gold Trust (ARCA:GLD)) and EM equities (iShares MSCI Emerging Markets (ARCA:EEM))…
Source: Short Side of Long
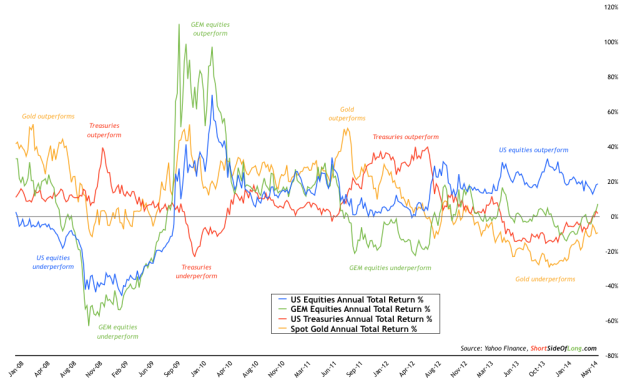
Looking at the global macro from a four asset class perspective, the chart above shows that US equities continue to outperform all other competition over the last 12 months. Now, I already understand that some readers will kindly correct me by stating that Treasuries and EM equities have actually outperformed US equities over the last several weeks.
This is definitely true if we look at the rolling quarterly performance, as opposed to rolling annualized gains seen in Chart 1. As a matter of fact, if one has a keen eye, they would notice that EM equities have outperformed the other majors over the last three months. So what is going on here?
Chart 2: …however it seems that EM equites are now playing catch up!

Source: Short Side of Long
Chart 2 is total return, nominal price movement, of the asset classes shown in Chart 1. For easier compression, I have chosen to keep same colour coding. Three out of the four asset classes seem to be following a script we discussed in previous Global Macro update posts.
US equities are still resuming their uptrend, Gold is still resuming its downtrend and while Treasuries have rallied strongly from oversold conditions, they still look to be in some kind of a downtrend consolation period. However, this is where EM equities start to looking interesting as the script seems to be changing.
Over the last two years, emerging market stocks have under-performed in a sideways consolation, but now we have a technical breakout on the upside. Are we seeing EM equities play catch up to DM equities? Let us remember that the majority of global fund managers have remained extremely underweight this asset class over the last year, as reported by the Merrill Lynch Fund Managers Survey.
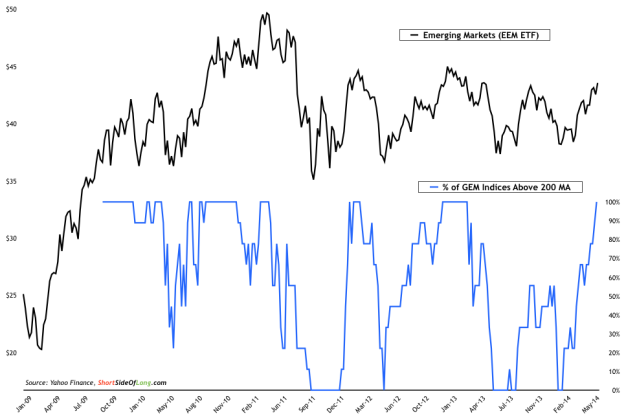
Chart 3: Strong breadth… a sign of broad participation or overbought?
Source: Short Side of Long
So is this just a short covering rally or are the fundamentals for emerging economies changing?
Well it is difficult to say right now because we never really know why the markets move at first. You see, my view has always been that the market is a discount mechanism and it prices in the future, not the present or the past. Let us remember the wise words of Jesse Livermore:
Of course there is always a reason for fluctuations, but what the tape does not concern itself with the why and wherefore. It doesn’t go into explanations. The reason for what a certain stock does today may not be known for two or three days, or weeks, or months. But what the dickens does that matter? Your business with the tape is now – not tomorrow. The reason can wait. But you must act instantly or be left.
Chart 3 shows incredibly strong breadth in the GEM equity Index. Every single major regional stock market is now trading above their respective 200 day MA. During downtrends, this tends to be an overbought signal. However, if a new uptrend is starting, rather then being overbought, this indicator tells us that the participation breadth is now very broad and healthy.
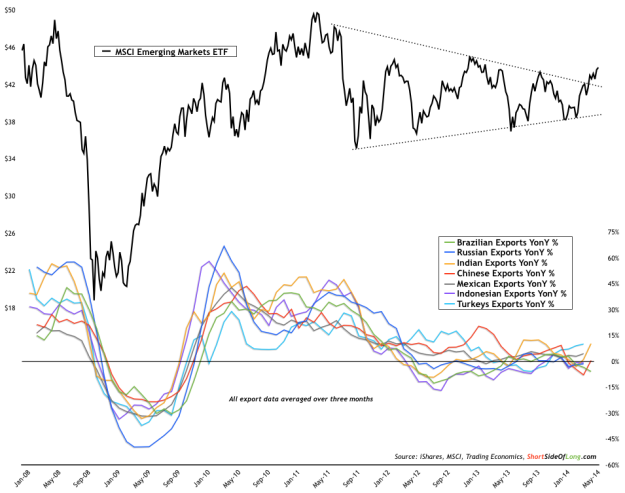
As discussed in the March Economic Update, global exports have been rather slow since their peak in 2011. The majority of the emerging economies, including the Emerging 7, have seen sluggish export demand at best (refer to Chart 4). However, some of the recent data out of China and India (if we can actually believe anything any government publishes) has been showing signs of life. For a trend follower, the wise thing to do is trade the breakout today and ask the questions later. After all, EM equities offer great valuations right now, especially when compared to the likes of US equities.
Chart 4: Markets lead lagging data, so what is EM Index discounting?
Source: Short Side of Long


