I have an important update regarding how far we could see the market drop in the short days and weeks ahead…
I’ve been warning for months that it looks like this bubble may finally be peaking.
I’ve warned that it’s best to get out of stocks a little early rather than a bit late. That’s because, when bubbles finally break, they burst rapidly – as much as 40% in the first few months. It can make markets very volatile, up and down, hence harder to predict and adjust to. If this is indeed the end, we’ve only taken the first step down a long ladder.
In retrospect, the odds keep going up that we saw a major long-term top on May 19.
The first warning sign was that, as stocks made little progress from late December into May, we saw a series of major tops around the world. And that to me is no small matter.
Dow Transports peaked in late November and are down 20% since.
Dow Jones Utilities peaked in late January and are down 18%.
The German DAX and British FTSE both peaked in April and are down 24% and 19%, respectively.
The Dow and S&P 500 appear to have peaked in late May. The Dow’s down 16% since then.
Then in June came China’s Shanghai Composite index – one of the leading dominoes to fall – and it’s crashed 42%. The Russell 2000 index also peaked in June and is down a little more than 12%.
And finally, our NASDAQ, which peaked in late July, is recently down 21%.
Four of those are undeniably in bear territory. The Shanghai, DAX, Nasdaq and Dow Transports have crossed that 20% threshold that literally defines a bear market. A drop like that only raises the chances that a bubble is finally over. But thus far technical indicators only show that the Shanghai and DAX have peaked for good.
And all of this is just the first warning sign…
The second sign came when stocks broke out of the narrow and very bullish four-year S&P 500 Channel on August 21. In the past, I’d told our readers that would be the first clear breaking point. Only that would begin to signal a major top and at least a 20% correction.
Finally, the third sign came on September 11. Adam O’Dell, our Chief Investment and Technical Analyst, got a broad sell signal alerting that, at least for now, the bull market is over.
As I’ve said before, Adam and I have very different indicators. He doesn’t look at the long-term. I do. But for his short-term indicators to coincide with my predictions – that says something! So while Adam is not yet clear as to whether the overall bubble is over – nor will I be 100% convinced until U.S. stocks universally cross well over that 20% line – it’s clearly time to get defensive!
For now, we are still in the classic “crash season” that lasts from mid-August to mid-October. It’s during this time that markets are most likely to make large movements down. We’ve seen this in 1973-74, 1982, 1987, 1990, 2001-02, 2008 and 2011.
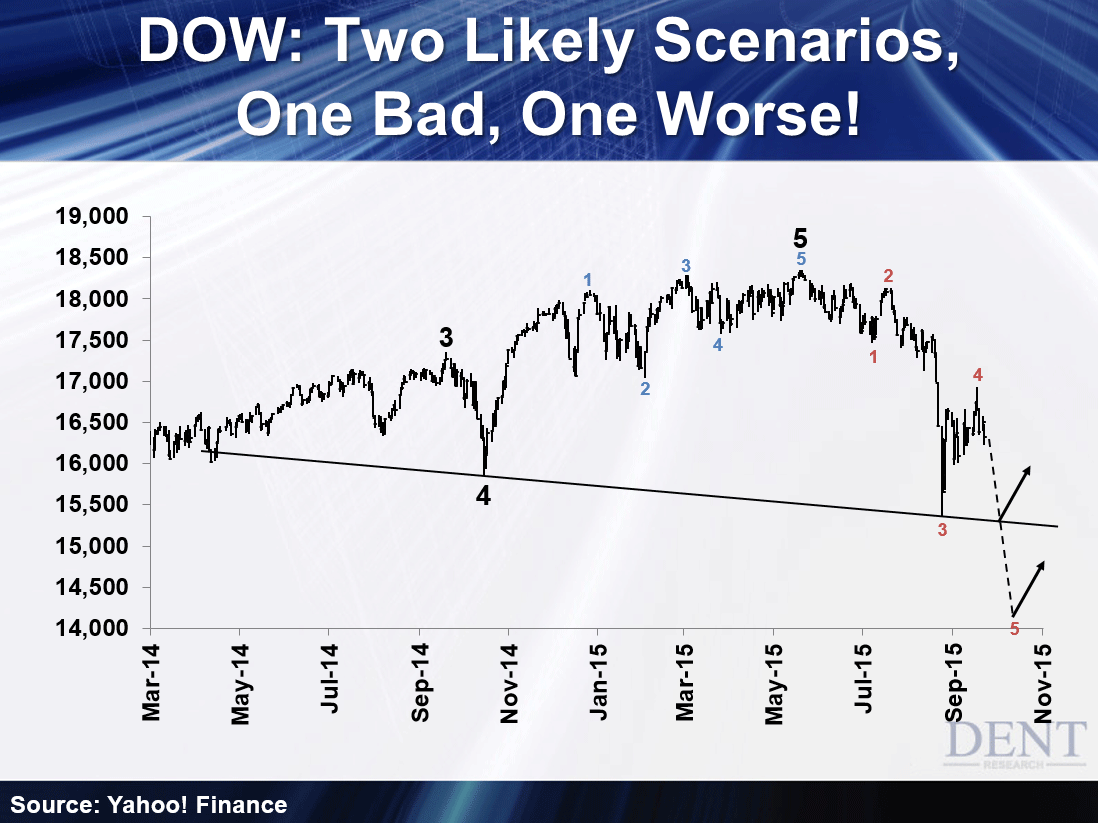
So given that we’re in the crash season, this chart shows two likely scenarios for the next leg down – one down a good bit, one down a lot more!

Based on Elliot Wave technical analysis that I won’t go into here, in my view, we are likely beginning the fifth wave down of the first broader wave. That’s what some of those markings are. And it’s likely this fifth wave will be as strong as the third one – the one that hit us in late August.
Notice the downward trend line I’ve drawn. In this scenario, at a minimum, the Dow hits a slight new low around 15,300. The Dow rebounded over 16,400 today, but that looks like another strong counter rally to the recent sharp correction. And that should be over today or by Monday at the latest. If the fifth wave likely just ahead is indeed as deep as the third as I expect, then don’t be shocked if the Dow hits 14,200.
That would be 23% off the all-time high. And that would be just another nail in the bubble’s coffin, to confirm it will not rise from the dead – although a strong bear market rally will very likely follow such a downward move into mid-October.
However far it falls in this fifth wave, I expect we’ll see this by around Friday, October 16. That’s just three weeks away.
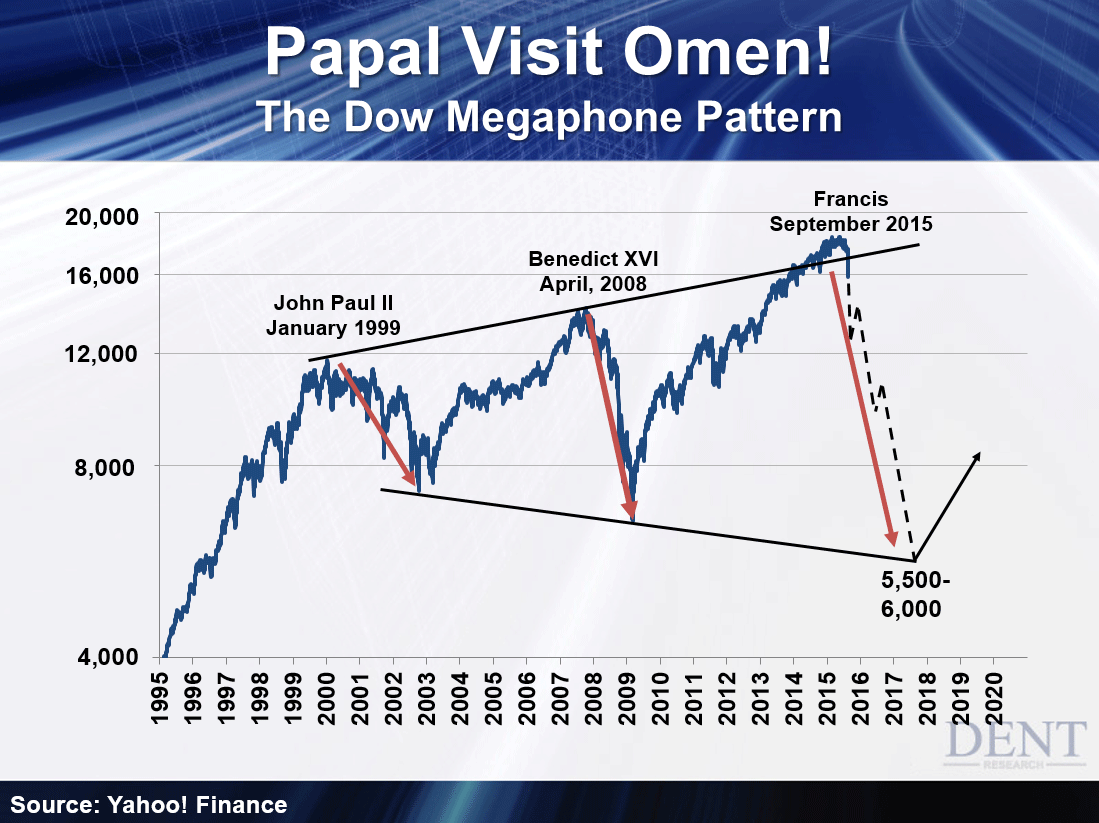
Of course, I see the Dow falling to 5,500 to 6,000 sometime by early 2017, and 3,300 or so after the dust settles, but that’s a longer story that you can watch here.
Where we are today, any number of things could kick off this next wave down.
It could be another crash in China, which frankly looks inevitable after China’s stocks have traded in a narrow range for weeks. It looks like we could see another major wave down soon to 2,400 to 2,500 – over 50% down.
It could be another sharp drop in oil to $30 to $32, like I’ve been predicting. As a wild card, it could even be a sharp spike up to $49 to $55, due to some major geopolitical event or war coming out of the Middle East now that Darth Vader Putin is involved.
That’s the point we’re at. This thing is teetering on an edge and any number of things could send Humpty Dumpty over the wall.
I’ll wrap this up on a lighter note. Enjoy it. You know I’m not one for jokes or small talk.
It just so happens, every time the Pope comes this side of the Atlantic, it lines up very closely with the bubble peaks we’ve had since 2000 on my Dow megaphone pattern, which points to 5,500 to 6,000 for the next down move. It seems he only comes at the top of good times, then things go to hell in a handbasket after. Go figure!
I call it, the “Papal Visit Omen.”

So enjoy the Pope’s visit while you can. This bubble’s days are numbered.
