Forex News and Events:
The EM currencies are under pressure, the RUB sold-off aggressively amid a Russian warplane attacked a Ukrainian jet yesterday before a Malaysian commercial plane has been shot down with its 298 passengers on board. USD/RUB rallied to 35.2903 (highest since May 9th) as the most RUB-sensitive TRY, BRL and ZAR were hit hard by tensions in Ukraine. In the Middle-East, the tensions between Israel and Palestine are also escalating. The given risk-off sentiment is clearly unfortunate for Turkey, which freshly cut its benchmark rate to 8.25% in July 17th meeting.
RUB victim of heavy unwind
The aggressive sell-off in Ruble is the typical example of why we keep talking about risk. In exchange of risk-taking, investors may hope to benefit from good interest rate differential in high yielding EM, combined to carry-sustained FX rates. Yet once the risks materialize, the carry strategies may result in meaningful loses due to sharp moves in FX markets in the opposite direction. After four month of sustainable appreciation, USD/RUB fully erases the past two month gains. The selling pressures should continue weighing on Ruble until tensions ease. The Russian President Putin insisted on the “necessity for the quickest peaceful resolution of the acute crisis in Ukraine”.
The Russian Central Bank is now studying the impacts of geopolitical risks and additional sanctions on the financial stability, saying that it has instruments to support the economy. Additional tools would be added in case of need.
Turkey: the cost of easing may hurt the economy
The Turkish Central Bank cut the 1-week benchmark repo rate by 50 basis points to 8.25% in July 17th meeting. The overnight borrowing rate has been shifted lower by 50 basis points; the overnight lending rate remained stable at 12.00%. The uncertainties regarding the timing of Fed normalization certainly gives this opportunity window for the third straight month cut, whereas the geopolitical situation of Turkey raises the cost of the tactical easing via higher risks on downside TRY-volatilities and undesired impact on the inflation outlook.
The CBT continues keeping its cautious stand via stable upper band, well aware of the geopolitical and political risks the country is subject to. The escalating tensions in Ukraine yesterday lifted USD/TRY up to 2.1439 in Asia open, the pair traded above the 100-dma resistance (currently at 2.1348) for the first time since March 31st (post local elections rally). USD/TRY should step into a short-term bullish reversal pattern for a daily close above 2.1329 (MACD pivot).
TRY-sensitivity to political and geopolitical tensions is the reason why the risk premium of TRY holdings is high. Although we are not experts in politics, the tensions in Iraq, Israel/Palestine, Ukraine/Russia and the upcoming presidential elections have certainly negative impacts on Turkey’s country risk. These risks need to appear somewhere in prices. The CBT rates are obviously the base of risk pricing. Apparently, TRY holdings do not pay good premium to enhance carry returns only. Was Turkey ready to reduce its risk pricing in this environment? Not sure.
Remains the unresolved issue with the inflation outlook. The CBT pulled the 1-week repo benchmark to 8.25% in July 17th, whereas the inflation remains above 9.00%. This means that investors will whether face negative real rates until the inflation curve improves, or take additional individual risk to improve their returns. In this respect, we believe it would have been more appropriate to wait until the inflation cool-down materializes, rather than do-first-see-after behavior. The CBT will release its quarterly inflation report in July 24th, Governor Basci will make a presentation in Ankara. We remind that the Turkish headline inflation eased to 9.16% in June (vs. 8.80% consensus); the CPI is almost as twice higher than the CBT target 5.0%.
Moving forward, the risk of policy misalignment should lead to a second round of emergency action and this is clearly no good for central bank’s credibility. We anticipate an upshift in USD/TRY toward 2.15/16 by the end of third quarter.

Today's Key Issues (time in GMT):
2014-07-18T12:30:00 CAD May Wholesale Trade Sales MoM, exp 0.60%, last 1.20%
2014-07-18T12:30:00 CAD Jun CPI NSA MoM, exp 0.00%, last 0.50%
2014-07-18T12:30:00 CAD Jun CPI YoY, exp 2.30%, last 2.30%
2014-07-18T12:30:00 CAD Jun CPI Core MoM, exp -0.20%, last 0.50%
2014-07-18T12:30:00 CAD Jun CPI Core YoY, exp 1.70%, last 1.70%
2014-07-18T12:30:00 CAD Jun CPI SA MoM, exp 0.30%, last 0.20%
2014-07-18T12:30:00 CAD Jun CPI Core SA MoM, last 0.20%
2014-07-18T12:30:00 CAD Jun Consumer Price Index, last 125.8
2014-07-18T13:55:00 USD Jul P Univ. of Michigan Confidence, exp 83, last 82.5
2014-07-18T14:00:00 USD Jun Leading Index, exp 0.50%, last 0.50%
The Risk Today:
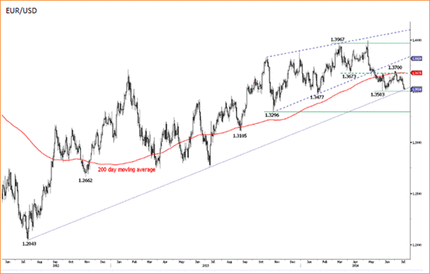
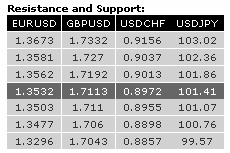
EUR/USD is close to the key support at 1.3503 (see also the long-term rising trendline from the July 2012 low). An initial resistance now lies at 1.3540 (17/07/2014 high). Hourly resistances can be found at 1.3562 (15/07/2014 low) and 1.3581 (intraday high). In the longer term, the break of the long-term rising wedge (see also the support at 1.3673) indicates a clear deterioration of the technical structure. A long-term downside risk at 1.3379 (implied by the double-top formation) is favoured as long as prices remain below the resistance at 1.3700. Key supports can be found at 1.3477 (03/02/2014 low) and 1.3296 (07/11/2013 low).
GBP/USD is consolidating after the failure to break the resistance at 1.7180. The hourly support at 1.7110 (61.8% retracement of the recent rise) has been broken. Another support stands at 1.7060. In the longer term, the break of the major resistance at 1.7043 (05/08/2009 high) calls for further strength. Resistances can be found at 1.7332 (see the 50% retracement of the 2008 decline) and 1.7447 (11/09/2008 low). A support lies at 1.6923 (18/06/2014 low).
USD/JPY has thus far successfully tested the hourly support at 101.07. An hourly resistance lies at 101.58 (intraday high), while a resistance area can be found between 101.79 (16/07/2014 high) and 101.86. A long-term bullish bias is favoured as long as the key support 99.57 (19/11/2013 low) holds. However, a break to the upside out of the current consolidation phase between 100.76 (04/02/2014 low) and 103.02 is needed to resume the underlying bullish trend. A major resistance stands at 110.66 (15/08/2008 high).
USD/CHF has broken a key resistance area between 0.8959 and 0.8975. Another key resistance area stands between 0.9013 (16/06/2014 high) and 0.9037. Hourly supports can be found at 0.8955 (16/07/2014 low) and 0.8938 (09/07/2014 high). From a longer term perspective, the bullish breakout of the key resistance at 0.8953 suggests the end of the large corrective phase that started in July 2012. The long-term upside potential implied by the double-bottom formation is 0.9207. A strong resistance stands at 0.9156 (21/01/2014 high).

