The major economic event on 24th June 2016 that is the BREXIT has caused a drop of more than 1700 pips in a single day in the GBP/USD pair. The Great Britain Pound suffered almost a free fall from the high of 23rd June 2016.The pair suffered the loss for more than 6 consecutive days which ended near the critical support level of 1.27800.Though the whole world economy was shattered by the sudden BREXIT news the pair managed to cease it decisive move near 1.27800 giving an ease to the mighty pound investor. From that critical support level, the pair managed to bounce back for 700+ pips just in 1 week!.
However, trained professional believe that there will be the long lasting major economic impact of BREXIT in GBP pairs. During the upward correction followed by the free fall, the pair stumbled near the 1.34839 where the first critical resistance level of pair resides. The impact was so heavy that the pair even could not manage to retrace back to 38.2% Fibonacci level. The upward correction was restricted by the 23.8% Fibonacci retracement level where the bears again entered fresh short to initiate another dive down. Eventually, the pair managed to find enough sellers which drove the price again to negative 400+ pips n the correction.
By now the pair is now in tradable format after the extreme volatility created in the pair during the BREXIT announcement. Let’s see the important level of the GBP/USD pairs
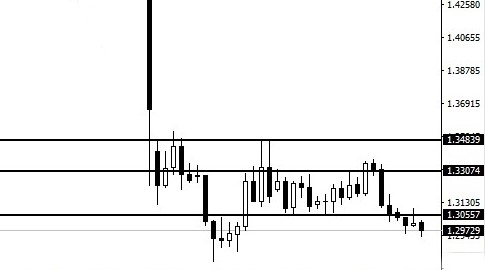
Figure: Major support and resistance level in GBP/USD daily chart.
The first critical resistance level of the GBP/USD pair is 1.34839 which initially restricted the correction of the pair followed by the free fall. The second minor resistance level of the pair 1.33074 which creates range trading opportunities for the traders. Finding a valid support is extremely tough after such massive decline in any pair, however, the great Britain pounds tends to form a temporary bottom near the key support level of 1.27855.Professional traders will look for price action signal near that region and ride the upward trend of the pair which might extend near to 50% correction level of Fibonacci retracement tools. let us see the graphical representation of the weekly chart of the GBP/USD pair along with Fibonacci retracement levels.
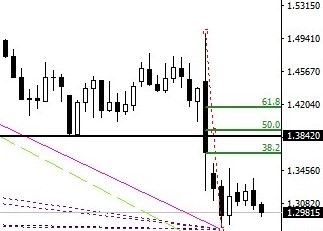
Figure: GBP/USD weekly chart
If the pair manages to hold the import support level of 1.28000 than we can expect the price to move upward with an initial correction of at least 50%.But the pairs needs to overcome heavy resistance level of 1.33074 and 1.34839 before it climbs back to 1.38420.It would be a premature act to buy this pair at this moment since there is good chance of retracing the low of 6th July 2016.For the buyers, the best possible scenario is buying as deep as they can with proper price action and risk management factors. There is no need to pursue a falling knife with such great level of volatility.
The monthly and the weekly chart of the GBP/USD pair gives us no buying opportunity rather it indicates clear sell signal which can lead to the long-term bearish trend .However selling this pair right now would be an act of novice participant since most of the time the pair manages to retraces back a significant amount of such massive decline. For instance, the SNB uncap caused more than 3000 pips downward rally in the USD/CHF pair in January 2015 which retraced back to more than 100% within only 3 months. We believe, if not 100% at least a 50% retracement of the pair will take place which will create an economic stability in the financial world. Since the pair extreme volatile, those who are eager to trade this pair can use the lower time frame like 4 hour or 1-hour time frame since the movement in that specified time frame is pretty much similar to the weekly and daily movement of the pair. It’s true that the extreme volatility of the pair has been luring us to make some quick green pips but most of the time such offers leads to the extreme loss in the trading account and shakes our long lasting trading performance.
In the 4 hour time frame, the GBP/USD pair has formed a nice bullish Gartley harmonic pattern which strongly favors upward momentum of the pair towards the major critical resistance level of 1.38420.But the price has already traded more than 300 pips above the initial bottom of the pair which strongly argues taking any long position in this pair. In the eyes of trained professional, there is the strong possibility of another downward move of at least 200 – 250 pips which might open the doors for the bulls to drive the price back towards 50% retracement level. So, in the opinion of experts it's highly advised not to buy this pair at the current price level rather wait cautiously for suitable long entry opportunity near the bottom of this pair. During such extreme volatility in the financial instrument it is highly advised to use the trailing stop loss features since it will greatly reduce the potential loss involved in any trade and give you a narrow window to book your profit at your convenient time.
Summary
There Great Britain Pound is trying to recover its losses after the BREXIT news which shocked the whole world economy. Buying this pair at the current level would be an immature act and selling is definitely not our pick at this moment. Suitable short entry can be found once the pair retraces back to the 50% Fibonacci retracement level. It’s important that the sellers use proper price action confirmation signal on the higher time frame while trading this pair. On the contrary , a clear bullish break of the 61.8% Fibonacci retracement level on the weekly chart will create the unique opportunity to eradicate all loss incurred during BREXIT event.

