
I'm currently in a GBP trade that is in my favor I'd like to take a closer look at why this trade illustrates how simple support/resistance analysis can be an incredibly powerful tool for forecasting price. I should note, though, that the position did initially go against me -- so I had a small floating loss for a bit and while it is currently in my favor, I'm not out yet. So this post is meant to help with entry, but that is only part of the story; proper trade management and exit strategy are also vital for trading success.
Clear Support
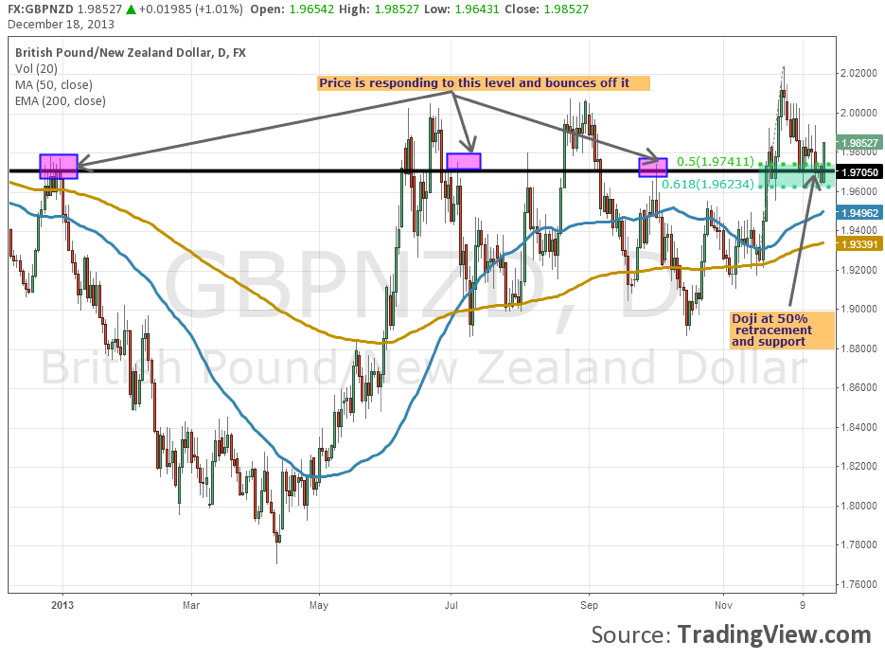
The chart below shows a very clear support level in black. We can identify this as a clear support level because of how price has behaved when it reached that level before. Specifically, we have at least three instances of price bouncing off that level and reversing direction. This tells us this may be a level that triggers buyers and sellers into the market to cause a sharp move.
Sharp Candles
On the right side of the chart we see a sharp candle upwards shortly after price reached this level. We also see that this black line is near the 50% retracement level of the move up from November 19 to November 29 and that there was a doji at this level just 2 trading days ago. The retracement level and the doji candlestick pattern give us more signs that price may be ready to reverse from here.
Clear Support
The chart below shows a very clear support level in black. We can identify this as a clear support level because of how price has behaved when it reached that level before. Specifically, we have at least three instances of price bouncing off that level and reversing direction. This tells us this may be a level that triggers buyers and sellers into the market to cause a sharp move.
Sharp Candles
On the right side of the chart we see a sharp candle upwards shortly after price reached this level. We also see that this black line is near the 50% retracement level of the move up from November 19 to November 29 and that there was a doji at this level just 2 trading days ago. The retracement level and the doji candlestick pattern give us more signs that price may be ready to reverse from here.