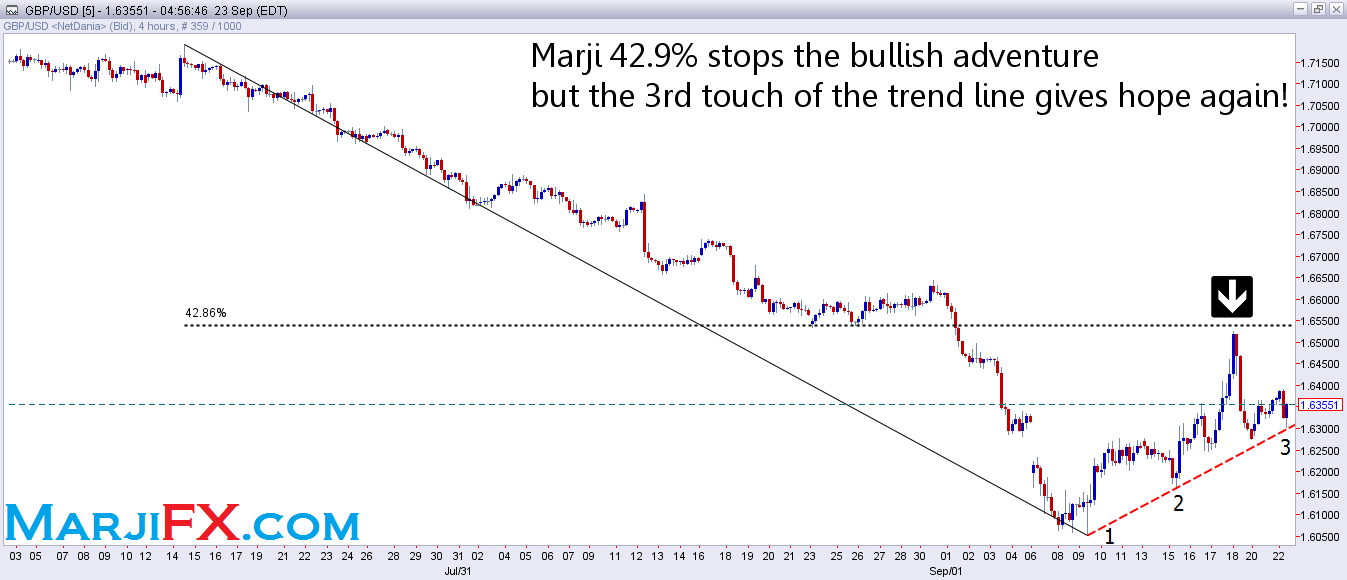
In spite of the several factors pointing lower, the bears were unable to break below the rising GBP/USD trend line from September 10th bottom. On the contrary, the price performed an accurate test of this line, and started recovering.
This gave the pound the chance to catch a breath after the losses seen following reaching Friday’s high. However, this recovery did not, up until now, reach what I consider to be a “real test” for its strength, at 1.6404. This level in my opinion is capable of estimating the strength of this bounce after touching the abovementioned trend line. A break above this level would suggest that the bulls are capable of moving higher, but they will still have to prove themselves against 1.6432 and 1.6455. A break above this level in specific is the one that would convince us that there might be a higher top for this correction (above 1.6523), and in this case 1.6620 makes a perfect target.
As for the support levels, we first have the rising trend line from the September 10th bottom, which is currently running very close to the current daily low at 1.6301. This level is closely followed by a “confirmation level” at 1.6287. Friday’s low at 1.6285 does not support the bearish ideas because it is only 2 pips below the short term Fibonacci 50% retracement. This retracement at 1.6287 is the support we need to care about most, even with the trend line being at 1.6301.
Without a break below it the bears will be held down. A break below this level (in case it actually happens) would signal that the whole rising correction from 1.6050 is most probably over, and that we are on the way to the test the major Fibonacci level at 1.6001. Such a test, in case it actually happens, would be very important and very informing for the medium term analysis of this pair. Of course, there are important levels between 1.6287 and 1.6001, these levels include 1.6231, 1.6185, 1.6155, 1.6090 and of course 1.6050.
Support:
• 1.6301: the current daily low at the time of preparing this report, which is very close to the rising trend line from September 10th bottom.
• 1.6287: the short term Fibonacci 50% retracement calculated for the whole rising move from September 10th 10-month low 1.6050 to Friday's high 1.6523. This level was tested late on Friday, with amazing accuracy, when the price reached a daily low only 2 pips below it.
• 1.6253: the short term Marji 57.1% retracement calculated for the whole rising move from September 10th 10-month low 1.6050 to Friday's high 1.6523.
• 1.6231: the short term Fibonacci 61.8% retracement calculated for the whole rising move from September 10th 10-month low 1.6050 to Friday's high 1.6523.
• 1.6185: the short term Marji 71.4% retracement calculated for the whole rising move from September 10th 10-month low 1.6050 to Friday's high 1.6523.
• 1.6155: the technically important daily high of September 9th.
• 1.6090: September 7th daily low.
• 1.6050: September 10th 10-month low.
• 1.6001: long term Fibonacci 50% calculated for whole enormous move from 2013 yearly low 1.4812 to July’s 6-year high 1.7190.
Resistance:
• 1.6404: micro term Fibonacci 50% retracement level calculated for the falling move from Friday’s 17-day high 1.6523 to the same day’s low 1.6285.
• 1.6432: micro term Fibonacci 61.8% retracement level calculated for the falling move from Friday’s 17-day high 1.6523 to the same day’s low 1.6285.
• 1.6455: micro term Marji 71.4% retracement level calculated for the falling move from Friday’s 17-day high 1.6523 to the same day’s low 1.6285.
• 1.6539: medium term Marji 42.9% retracement level, calculated for the whole move from July’s 6-year high 1.7190 to September 10th 10-month low 1.6050. This level was almost tested on Friday when the price topped 16 pips below it before dropping a little less than 240 pips.
• 1.6588: August 19th daily low.
• 1.6620: medium term Fibonacci 50% retracement level, calculated for the whole move from July’s 6-year high 1.7190 to September 10th 10-month low 1.6050.
• 1.6656: August 13th daily low & short term bottom.
• 1.6701: medium term Marji 57.1% retracement level, calculated for the whole move from July’s 6-year high 1.7190 to September 10th 10-month low 1.6050.
Trend:
• Short term: Up, as long as we are above 1.6285/7.
• Medium term: Up, as long as we are above 1.6285/7.
• Long term: Up, as long as we are above 1.5492.
Disclosure: This article originally appeared on MarjiFX.com
