GBP/USD for Wednesday, February 5, 2014
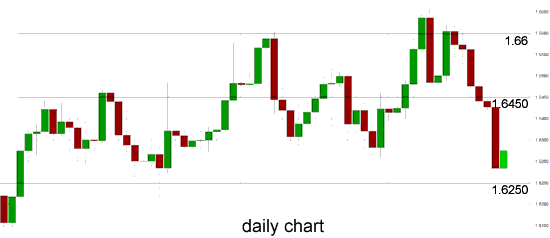
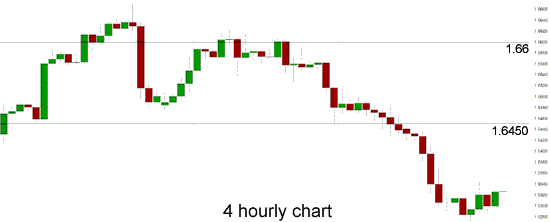
Over the last week the GBP/USD has fallen sharply and experienced its worst one week fall this year which has resulted in moving to the six week low near the current support level at 1.6250. In the last 24 hours it has been able to rally a little from that support level to back above 1.63. Over the last couple of months the pound has established and traded within a trading range roughly around the key level of 1.6450, whilst moving down to support at 1.6250 and up to 1.66. Over the last few weeks or so the pound has moved very strongly pushing through resistance levels at 1.6450 and more recently at 1.66 however it has since returned those gains. The 1.66 level has become quite significant as it had been looming large over the last month or so and a couple of weeks ago it moved through, reaching a new multi-year high close to 1.6670. Since that time however it has retraced strongly and moved back below the 1.66 level only to be rejected again over the last week before falling sharply again to below 1.6450.
Several weeks ago it rallied again trying to break through the 1.6450 level before dropping back to a support level at 1.6350. In late November it did well to break through the long term resistance level at 1.6250 which had established itself as a level of significance over the last few months. This level continues to play a role in providing support. In early November, the pound bounced strongly off the support level at 1.59 to return back to above 1.6250. Towards the end of October the GBP/USD slowly drifted lower from the strong resistance level at 1.6250 and down to a three week low just around 1.5900 which was recently passed as the pound moved down towards 1.5850 only a week ago. For the week or so before that the pound moved well from the key level at 1.60 back up to the significant level at 1.6250, only again for this level to stand tall and fend off buyers for several days.
Throughout September the pound rallied well and surged higher to move back up strongly through numerous levels which was punctuated by a push through to its highest level for the year just above 1.6250 several weeks ago. In the first week of October the pound was easing back towards 1.60 and 1.59 where it established a narrow trading range between before surging back to 1.6250 again.
Investors are betting Bank of England Governor Mark Carney will lead the charge out of record-low interest rates as central banks pivot from fighting stagnation to managing expansions. Economists at Citigroup Inc. and Nomura International Plc say the strongest growth since 2007 will prompt the U.K. to lift its benchmark from 0.5 percent as soon as this year. Money-market futures show an increase in early 2015. That’s at least three months before the contracts indicate Federal Reserve Chairman Janet Yellen will raise the target for the federal funds rate. European Central Bank President Mario Draghi and Bank of Japan Governor Haruhiko Kuroda are forecast to maintain or even ease monetary policy. “Carney and BOE officials will be looking at the domestic recovery, and if that is strong enough, then they will feel comfortable increasing rates before the Fed,” said Jonathan Ashworth, an economist at Morgan Stanley in London and former U.K. Treasury official. “Tightening by the major developed central banks will be gradual, and they will be aware of what everyone else is doing.”
 GBP/USD Daily chart " title="GBP/USD Daily chart " height="238" width="474">
 GBP/USD 4 hourly chart" title="GBP/USD 4 hourly chart" height="222" width="474">
GBP/USD February 4 at 23:15 GMT 1.6325 H: 1.6344 L: 1.6257
GBP/USD Technical
| S3 | S2 | S1 | R1 | R2 | R3 |
| 1.6300 | 1.6250 | 1.5900 | 1.6600 | --- | --- |
During the early hours of the Asian trading session on Wednesday, the GBP/USD is remaining very still between 1.6320 and 1.6330 after rallying higher from the support level at 1.6250. Current range: Right above support at 1.63 at 1.6320.
Further levels in both directions:
• Below: 1.6300, 1.6250 and 1.5900.
• Above: 1.6600.
OANDA’s Open Position Ratios
 GBP/USD Open Position Ratios" title="GBP/USD Open Position Ratios" height="26" width="474">
(Shows the ratio of long vs. short positions held for the GBP/USD among all OANDA clients. The left percentage (blue) shows long positions; the right percentage (orange) shows short positions.)
The GBP/USD long positions ratio continues to rise and move closer to 40% as the GBP/USD falls sharply back down towards 1.63. Trader sentiment remains in favour of short positions.
Economic Releases
- 00:01 UK BRC Shop price index (Jan)
- 08:58 EU Composite PMI (Jan)
- 08:58 EU Services PMI (Jan)
- 09:28 UK CIPS/Markit Services PMI (Jan)
- 10:00 EU Retail Trade (Dec)
- 13:15 US ADP Employment Survey (Jan)
- 13:30 CA Building permits (Dec)
- 15:00 US ISM Non-Manufacturing (Jan)
