
GBP/USD (daily chart) has rebounded from a double bottom formation around the 1.5900 support level. This occurs within a month-long consolidation after the pair trended up from July to hit a nine-month high at 1.6259 in early October.
After that high was reached, which was just short of major resistance at 1.6300, both a double top pattern and a double bottom pattern have formed within a well-defined trading range approximately between 1.5900 support and 1.6250 resistance.
Having just hammered out the double bottom around 1.5900 earlier this week, the pair has rebounded towards a potential re-test of the 1.6250 double top. Before it may potentially reach that level, the pair should bump up against intermediate resistance around 1.6150.
In the event of a breakout above both 1.6150 and the 1.6250 double top resistance, the price will have confirmed a continuation of the four-month uptrend and could then reach for further upside targets around the noted 1.6300 major resistance and then 1.6500.
Any breakdown below the 1.5900-area double bottom should find key support further to the downside around 1.5750.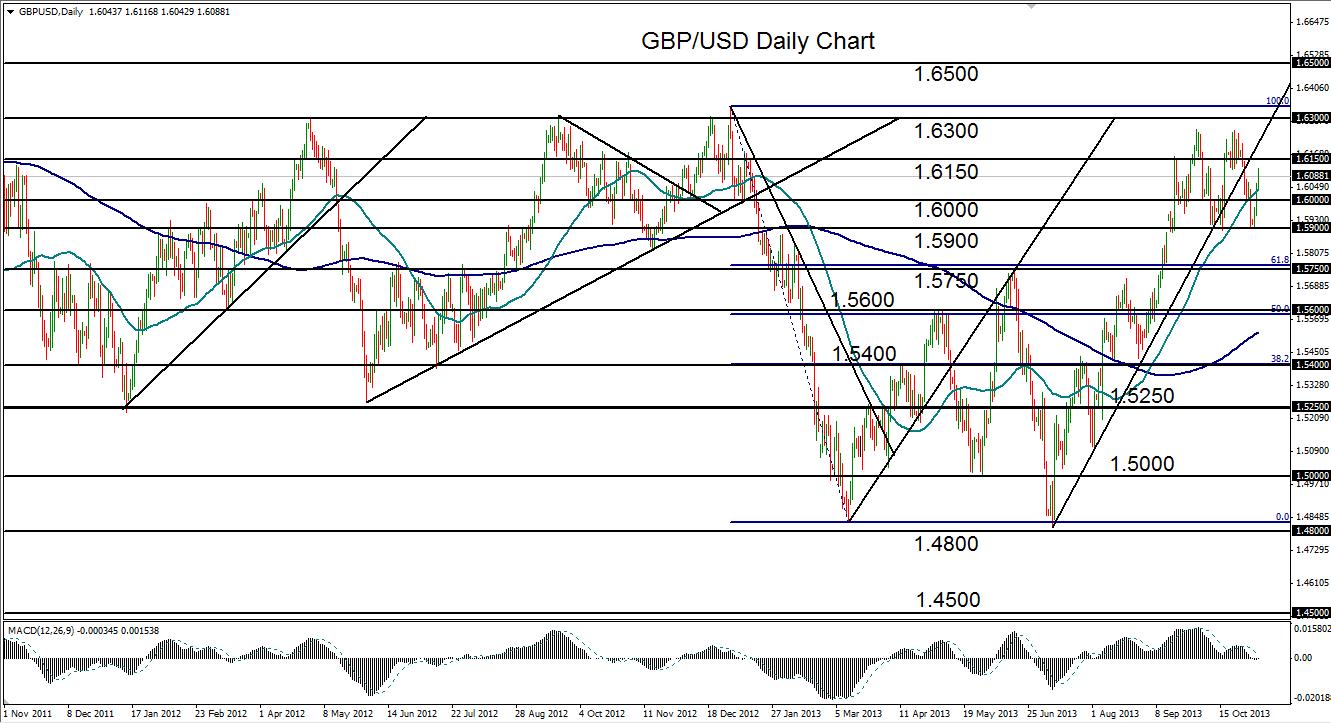 GBP/USD Daily Chart" title="GBP/USD Daily Chart" height="723" width="1331">
Disclosure: FX Solutions assumes no responsibility for errors, inaccuracies or omissions in these materials. FX Solutions does not warrant the accuracy or completeness of the information, text, graphics, links or other items contained within these materials. FX Solutions shall not be liable for any special, indirect, incidental, or consequential damages, including without limitation losses, lost revenues, or lost profits that may result from these materials.
The products offered by FX Solutions are leveraged products which carry a high level of risk to your capital with the possibility of losing more than your initial investment and may not be suitable for all investors. Ensure you fully understand the risks involved and seek independent advice if necessary.
- English (UK)
- English (India)
- English (Canada)
- English (Australia)
- English (South Africa)
- English (Philippines)
- English (Nigeria)
- Deutsch
- Español (España)
- Español (México)
- Français
- Italiano
- Nederlands
- Português (Portugal)
- Polski
- Português (Brasil)
- Русский
- Türkçe
- العربية
- Ελληνικά
- Svenska
- Suomi
- עברית
- 日本語
- 한국어
- 简体中文
- 繁體中文
- Bahasa Indonesia
- Bahasa Melayu
- ไทย
- Tiếng Việt
- हिंदी
GBP/USD Rebounds From Double Bottom Towards Double Top
ByFX Solutions
AuthorJames Chen
Published 11/07/2013, 12:59 AM
Updated 01/01/2017, 02:20 AM
GBP/USD Rebounds From Double Bottom Towards Double Top
3rd party Ad. Not an offer or recommendation by Investing.com. See disclosure here or
remove ads
.
Latest comments
Install Our App
Risk Disclosure: Trading in financial instruments and/or cryptocurrencies involves high risks including the risk of losing some, or all, of your investment amount, and may not be suitable for all investors. Prices of cryptocurrencies are extremely volatile and may be affected by external factors such as financial, regulatory or political events. Trading on margin increases the financial risks.
Before deciding to trade in financial instrument or cryptocurrencies you should be fully informed of the risks and costs associated with trading the financial markets, carefully consider your investment objectives, level of experience, and risk appetite, and seek professional advice where needed.
Fusion Media would like to remind you that the data contained in this website is not necessarily real-time nor accurate. The data and prices on the website are not necessarily provided by any market or exchange, but may be provided by market makers, and so prices may not be accurate and may differ from the actual price at any given market, meaning prices are indicative and not appropriate for trading purposes. Fusion Media and any provider of the data contained in this website will not accept liability for any loss or damage as a result of your trading, or your reliance on the information contained within this website.
It is prohibited to use, store, reproduce, display, modify, transmit or distribute the data contained in this website without the explicit prior written permission of Fusion Media and/or the data provider. All intellectual property rights are reserved by the providers and/or the exchange providing the data contained in this website.
Fusion Media may be compensated by the advertisers that appear on the website, based on your interaction with the advertisements or advertisers.
© 2007-2024 - Fusion Media Limited. All Rights Reserved.