GBP/USD remains trading flat, but price action indicates a near term correction, following the rally yesterday to test the resistance at 1.4668 - 1.46470. The markets look to another day of quiet trading except Janet Yellen's speech that could see some movements. EUR/USD has pulled back following the test of resistance to 1.1380 but remains trading flat on the longer term horizon.
EUR/USD Daily Analysis

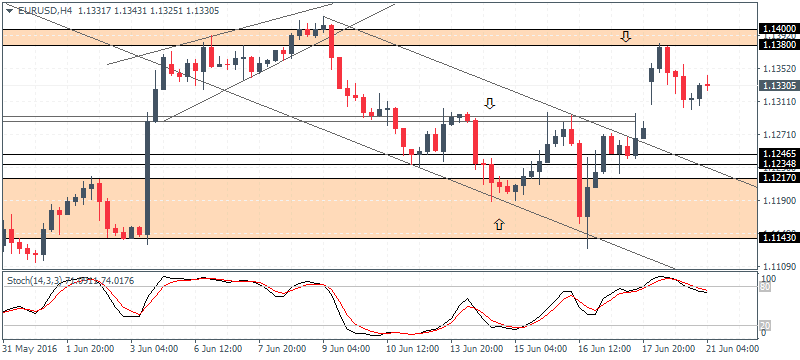
EUR/USD (1.133):EUR/USD closed bearish following the up gap on Monday as prices failed to break above the resistance near 1.140 - 1.1380. The ranging price action is likely to continue in the near term with the downside to 1.1294 - 1.1280 support likely to be tested in the near term. Below 1.1280 support, EUR/USD could fall back to the previous support at 1.1246 - 1.12350 lower support level. The sideways price action is likely to continue with a break above out 1.140 or below 1.1235 likely to set further directional bias.
USD/JPY DailyAnalysis

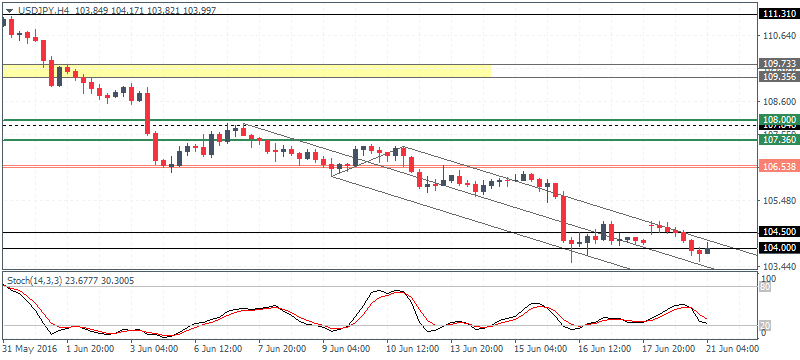
USD/JPY (103.9):USD/JPY closed bearish yesterday with prices inching closer to the 104 level, just below the identified support at 104.50 - 104.00 region. A break below 104.00 could keep USD/JPY subdued for further downside, to 103 and perhaps to 102.0, lower support level. The 4-hour chart shows the Stochastics currently posting a higher low against the lower low in prices. In the event of a break above 104.50, further upside could see USD/JPY test 106.50 minor resistance.
GBP/USD Daily Analysis

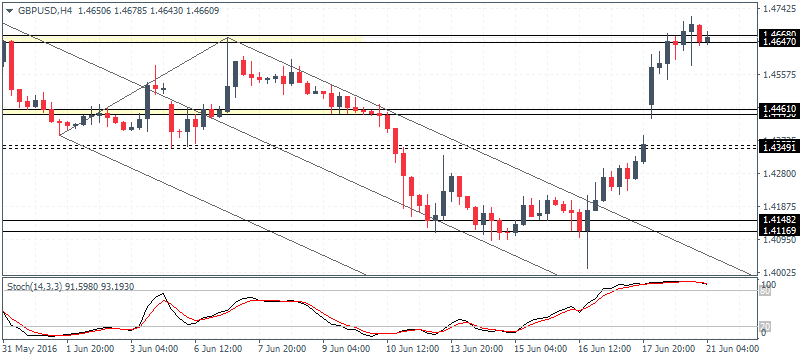
GBP/USD (1.466):GBP/USD has been bullish for the past two days following the doji candlestick pattern near 1.420. Price action has managed to close above 1.4635 and is trading at the major resistance level of 1.4743 - 1.4635. Only a break higher could trigger further upside in GBP/USD while in the near term, the weakening momentum could see some sideways price action. On the 4-hour chart, price action has stalled near 1.4668 - 1.4650 resistance level as noted, and could slip towards 1.4461 - 1.4445 lower support in the near term.
Gold Daily Analysis

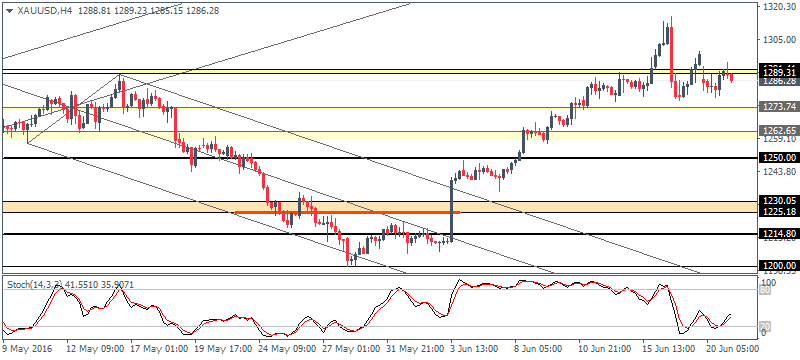
XAU/USD (1286.28):Gold prices remain trading within a range and price action has formed an inside bar, but caught below the 1300 resistance level. In the near term, gold prices could see a decline to lower support at 1273.75 - 1271.00, but the bias remains flat. A potential break above 1291 could, however, trigger further upside in gold prices.
