
Payroll day today. Yesterday’s ECB meeting produced no change in policy stance. With rates so close to zero already, the ECB has little room for manoeuver and since the economic news has generally been going their way, they decided to wait for more data before taking a decision. The surprise was that next month’s revision will include the forecasts for 2016 nine months before they were expected. Usually the ECB only forecasts two years in advance. This may paint them into a corner: if the ECB forecasts that inflation will remain substantially below their “close to but below 2%” target even in 2016, then they will in fact trigger the very “dis-anchoring” of market inflation expectations that they are concerned about and they would probably be obliged to loosen policy further as a result. In short, next month’s ECB meeting is going to be a key event.
The US economic data was mixed. Initial jobless claims remain around the level that they’ve been for the last several months. The trade deficit widened in December because of a decline in exports, which will subtract a few basis points from Q4 GDP growth. But unit labor costs declined for the second consecutive quarter and are now falling yoy, which may help the employment picture (but push inflation down further). Nonetheless US bond yields crept higher and the implied interest rates on Fed Funds continue to climb back up slowly as fears about an EM collapse recede. In fact EM equities outperformed DM equities yesterday, most EM currencies were unchanged to higher, and the VIX index fell sharply (-2.7 points), indicating that fear is receding from the market. Against that background, JPY was the big loser on the day as the safe-haven flows reversed. AUD/USD also fell after the RBA’s quarterly monetary policy statement said that “with the terms of trade expected to decline, the exchange rate could decline further over time.” The dollar was stable vs CAD after Canada’s trade deficit widened far more than expected in December. It was also stable vs NZD, but lost ground against the rest of the G10 currencies.
The main event today will be the non-farm payrolls for January. The December report came out much worse than expected with payrolls increasing only by 74,000 as bad weather lowered job growth. There were periods of cold weather in January as well, but the weather was more normal during the week of the survey. The market expects the figure to return to normal levels at 180k, while the unemployment rate is forecast to remain unchanged at 6.7%. If the figure comes in below expectations, people will be looking to see whether it was due to the weather again or if something more structural is at play. The way to discern this will be by looking at construction employment, which is strongly affected by the weather. Construction payrolls fell by 16,000 in December, bucking the trend of small gains during most of the year. Payroll firm ADP Wednesday said private construction employment grew by 25,000 last month. Today’s report will also include the annual revisions that could reshape the market’s (and the Fed’s) views of the labor market in 2013. The data currently show an increase of 182k jobs a month last year. The 2012 revisions added nearly 30k a month to the estimate for that year; a similar revision for 2013 would improve the perception of the US economy, probably raising interest rate expectations somewhat and strengthening the dollar. The reverse is also possible, of course.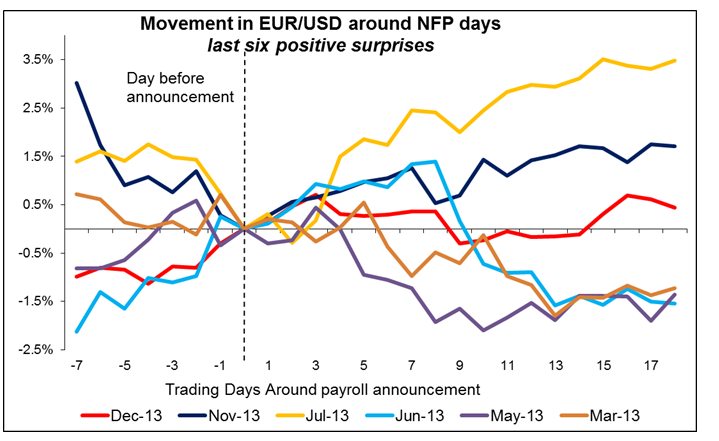 EUR/USD 1" title="EUR/USD 1" align="bottom" border="0" height="242" width="474" />
Which pair to play depends on whether you think the payrolls will beat the forecast or come in below forecast. If the number beats the forecast, then the most volatile currencies are JPY, silver, MXN, gold, NOK, DKK, and EUR, in that order. If they are below forecast, then the most volatile pairs are MXN, CHF, JPY, and gold (based on data over the last three years). Above-forecast numbers have tended to engender more volatility than below-forecast numbers, perhaps because for much of that time investors have thought that a strong number could bring about a change in monetary policy, whereas a weak number just meant the continuation of the current policy. That relationship might not continue going forward.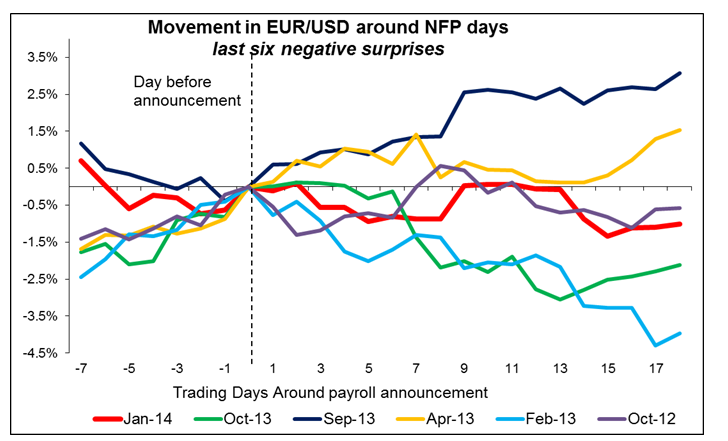 EUR/USD 2" title="EUR/USD 2" align="bottom" border="0" height="242" width="474" />
As for the rest of the indicators, we get industrial production for December from Sweden, Norway, Germany and the UK. Sweden’s IP is forecast to have been down mom, while Germany’s IP is expected to have slowed. On the other hand, UK industrial production are estimated to have accelerated, which could boost the pound, which has been beaten down recently. Canada’s unemployment rate is expected to have fallen to 7.1% in January from 7.2% in December.
We have four speakers scheduled on Friday’s schedule. During the Asian morning, Boston Fed President Eric Rosengren speaks at New College of Florida. ECB executive Board member Yves Mersch speaks on reviving growth in the Euro area, ECB Governing Council member George Provopoulos speaks on “The Greek financial crisis: From Grexit to Grecovery” and Bank of Canada Senior Deputy Governor Tiff Macklem will also give a talk.
The Market
 EUR/USD" title="EUR/USD" align="bottom" border="0" height="242" width="474" />
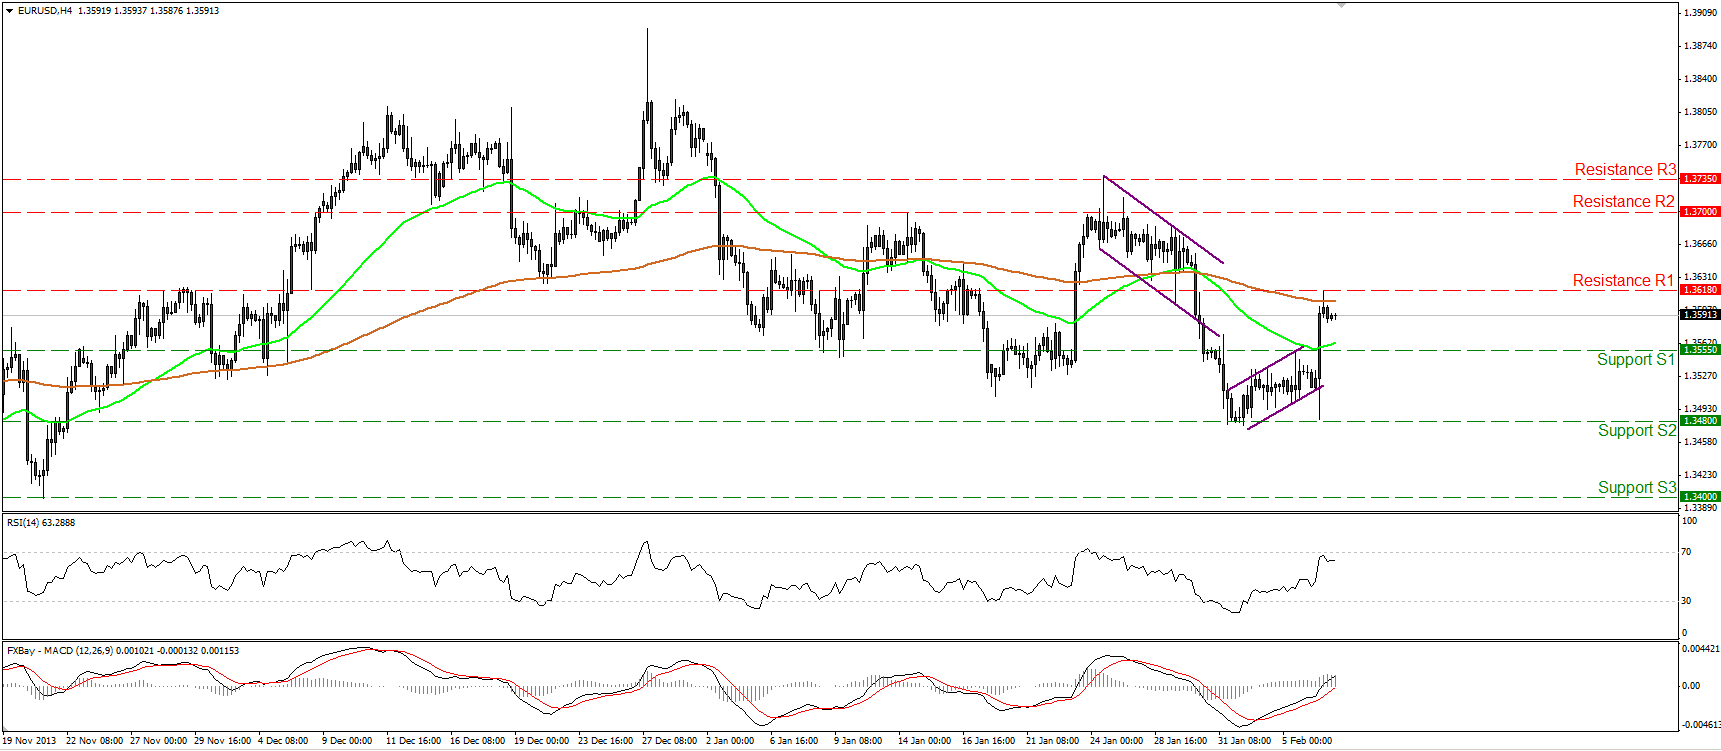
• EUR/USD surged yesterday after ECB president Mario Draghi didn’t provide signals for further easing in the coming meetings. The rally was stopped by the 1.3618 (R1) barrier near the 200-period moving average. However, the possibility for a lower high still exist and only a clear break above the 1.3735 (R3) barrier would signal that the decline from the 27th of December has ended. I would expect the rate to remain near its current levels until the nonfarm payrolls are out. A positive release may confirm the lower high and drive the rate below 1.3555 (S1), targeting once again the support at 1.3480 (S2). On the other hand, a negative surprise may generate another rally challenging the area of 1.3700 (R2).
• Support: 1.3555 (S1), 1.3480 (S2), 1.3400 (S3).
• Resistance: 1.3618 (R1), 1.3700 (R2), 1.3735 (R3).
 EUR/JPY" title="EUR/JPY" align="bottom" border="0" height="242" width="474" />
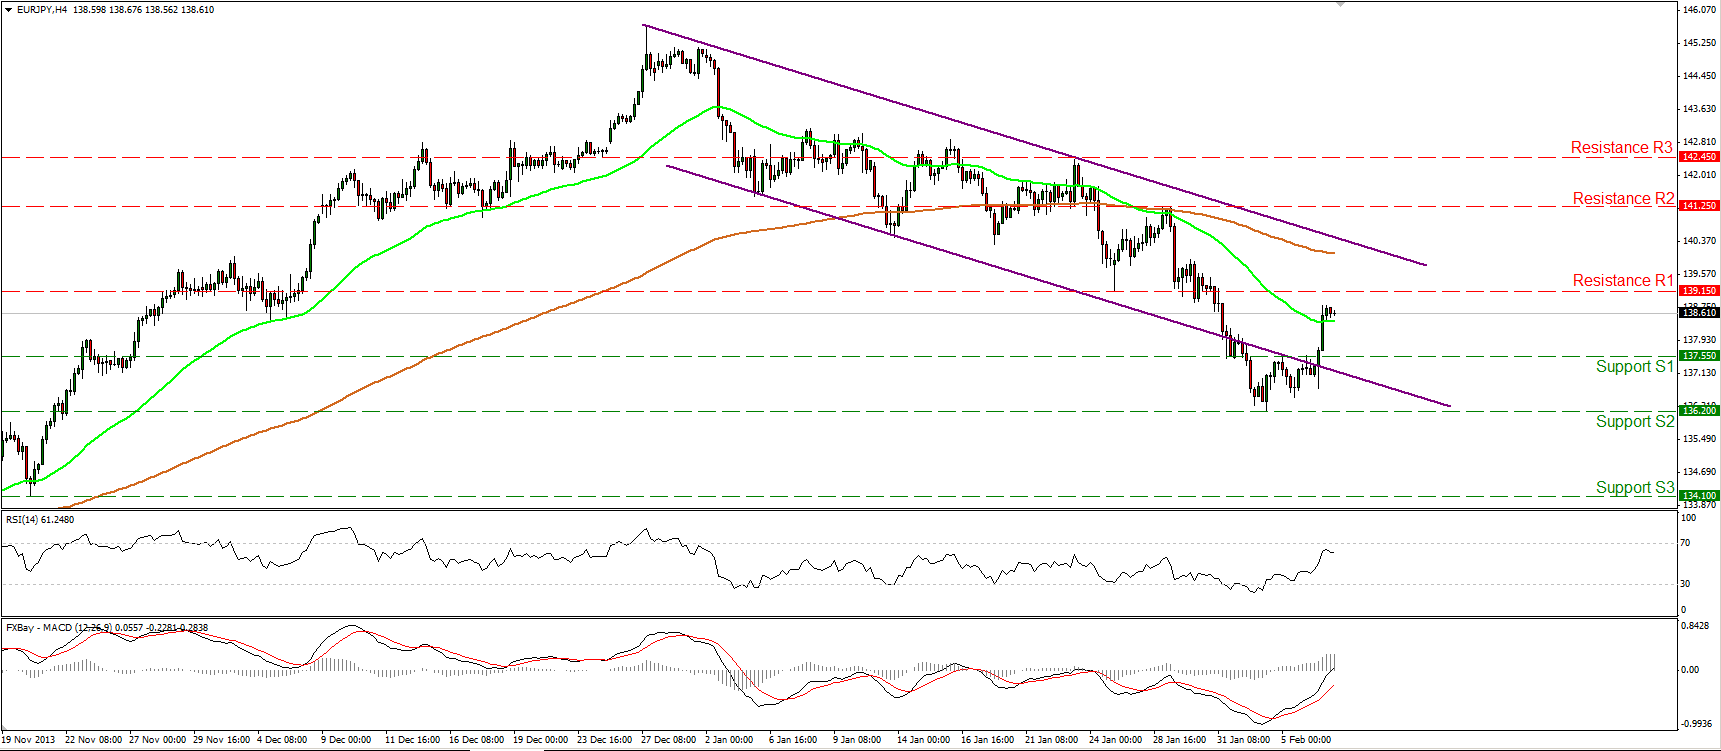
• EUR/JPY also rallied on Draghi’s comments and is back within the purple downward sloping channel. As long as the high of 141.25 (R2) holds the short-term trend remains a downtrend. The MACD oscillator, already above its trigger line, entered its positive territory, confirming the recent positive momentum. I expect any further advance to be limited near the 200-period moving average and the upper boundary of the downward sloping channel.
• Support: 137.55 (S1), 136.20 (S2), 134.10 (S3).
• Resistance: 139.15 (R1), 141.25 (R2), 142.45 (R3).
 GBP/USD" title="GBP/USD" align="bottom" border="0" height="242" width="474" />
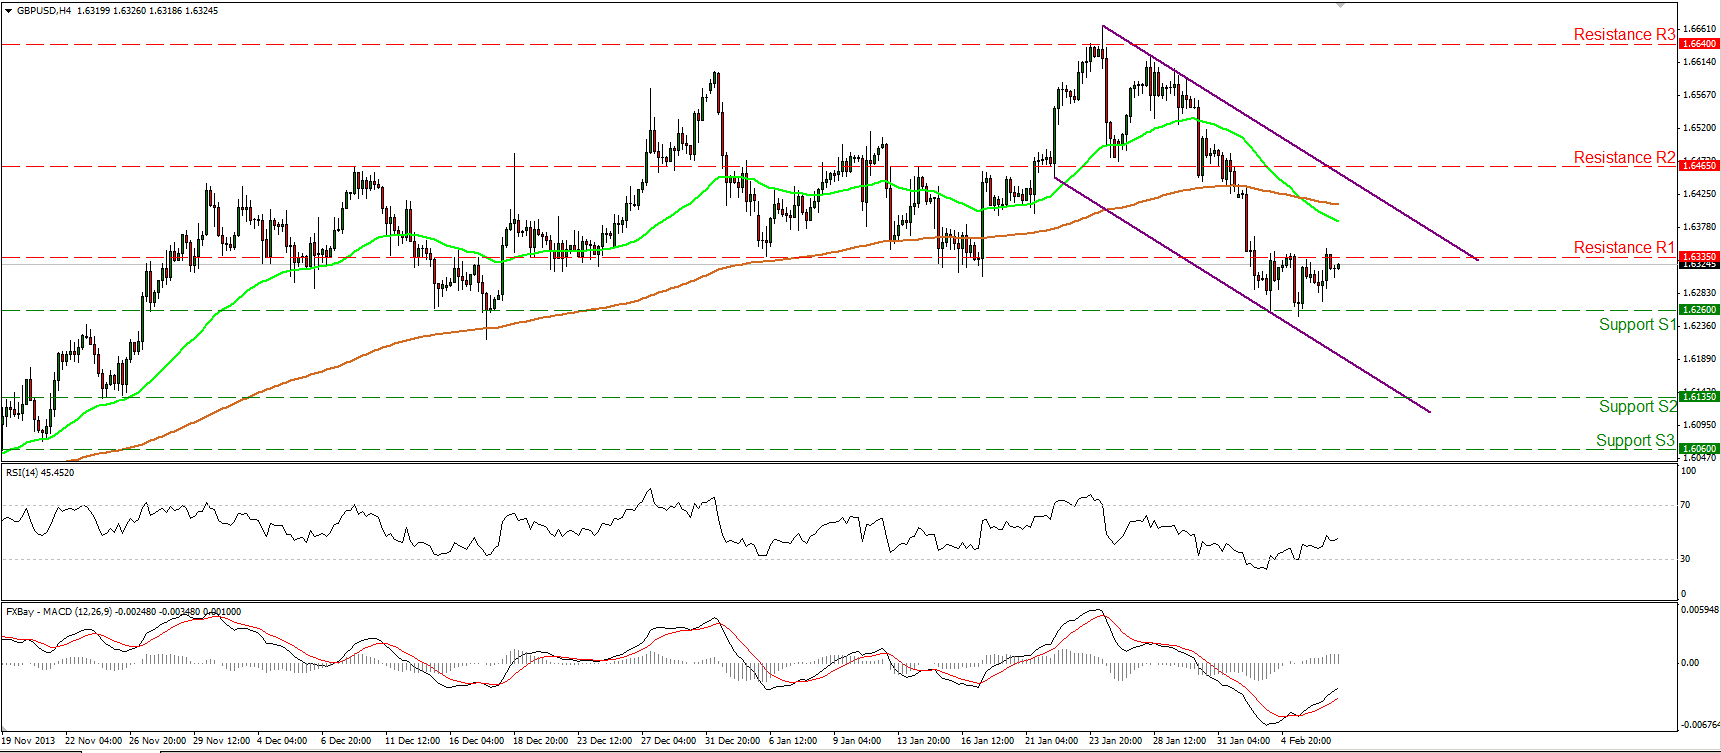
• GBP/USD failed to overcome the strong barrier of 1.6260 (S1) and moved in a consolidative mode between that barrier and the resistance of 1.6335 (R1). A rise in UK industrial production coming out today could provide the impetus for a break above the 1.6335 (R1) resistance. Nonetheless, as long as the pair is printing lower highs and lower lows within the downtrend channel and the 50-period moving average lies below the 200-period moving average, the short-term trend remains to the downside. As a result, I would consider any additional advance today as a corrective wave. The corrective wave is also favored by two hammer candles on the daily chart.
• Support: 1.6260 (S1), 1.6135 (S2), 1.6060 (S3).
• Resistance: 1.6335 (R1), 1.6465 (R2), 1.6640 (R3).
Gold

• Gold moved slightly higher but remained between the support level of 1250 (S1) and the resistance at 1268 (R1). The precious metal maintains its price above both the moving averages, which is a bullish indication. A daily close above the aforementioned resistance could turn the picture positive again. On the other hand, a break below the support barrier of 1235 (S2) is needed to confirm that the 19th Dec. - 27th Jan advance was just a retracement of the major downtrend.
• Support: 1250 (S1), 1235 (S2), 1220 (S3).
• Resistance: 1268 (R1), 1290 (R2), 1315 (R3).
Oil

• WTI hit the prior short-term uptrend line once again and moved lower. A downward violation of the support at 96.50 (S1) may signal the completion of a possible short-term reversal and have larger bearish implications. On the other hand, an upward break above the resistance at 98.80 (R1) could turn the picture bullish again. The mixed picture is confirmed by the fact that the price is trading above both the moving averages, while both the MACD and the RSI continue declining. On the weekly chart a spinning top candle might be completed after the close of this week and confirm the neutral environment WTI is trading, for now.
• Support: 96.50 (S1), 95.00 (S2), 94.00 (S3).
• Resistance: 98.80 (R1), 100.55 (R2), 102.00 (R3).
BENCHMARK CURRENCY RATES - DAILY GAINERS AND LOSERS

MARKETS SUMMARY

Disclaimer: This information is not considered as investment advice or investment recommendation but instead a marketing communication. This material has not been prepared in accordance with legal requirements designed to promote the independence of investment research, and that it is not subject to any prohibition on dealing ahead of the dissemination of investment research. IronFX may act as principal (i.e. the counterparty) when executing clients’ orders. This material is just the personal opinion of the author(s) and client’s investment objective and risks tolerance have not been considered. IronFX is not responsible for any loss arising from any information herein contained. Past performance does not guarantee or predict any future performance. Redistribution of this material is strictly prohibited. Risk Warning: Forex and CFDs are leveraged products and involves a high level of risk. It is possible to lose all your capital. These products may not be suitable for everyone and you should ensure that you understand the risks involved. Seek independent advice if necessary. IronFx Financial Services Limited is authorised and regulated by CySEC (Licence no. 125/10). IronFX UK Limited is authorised and regulated by FCA (Registration no. 585561). IronFX (Australia) Pty Ltd is authorized and regulated by ASIC (AFSL no. 417482)