Get 40% Off
🚨 Volatile Markets? Find Hidden Gems for Serious OutperformanceFind Stocks Now

Contrarians Take Note: Fund Managers Are Very Bullish Equities

Published 02/25/2015, 02:25 AM
Updated 07/09/2023, 06:31 AM

Chart 1: Recent fund manager long exposure has averaged above 80%
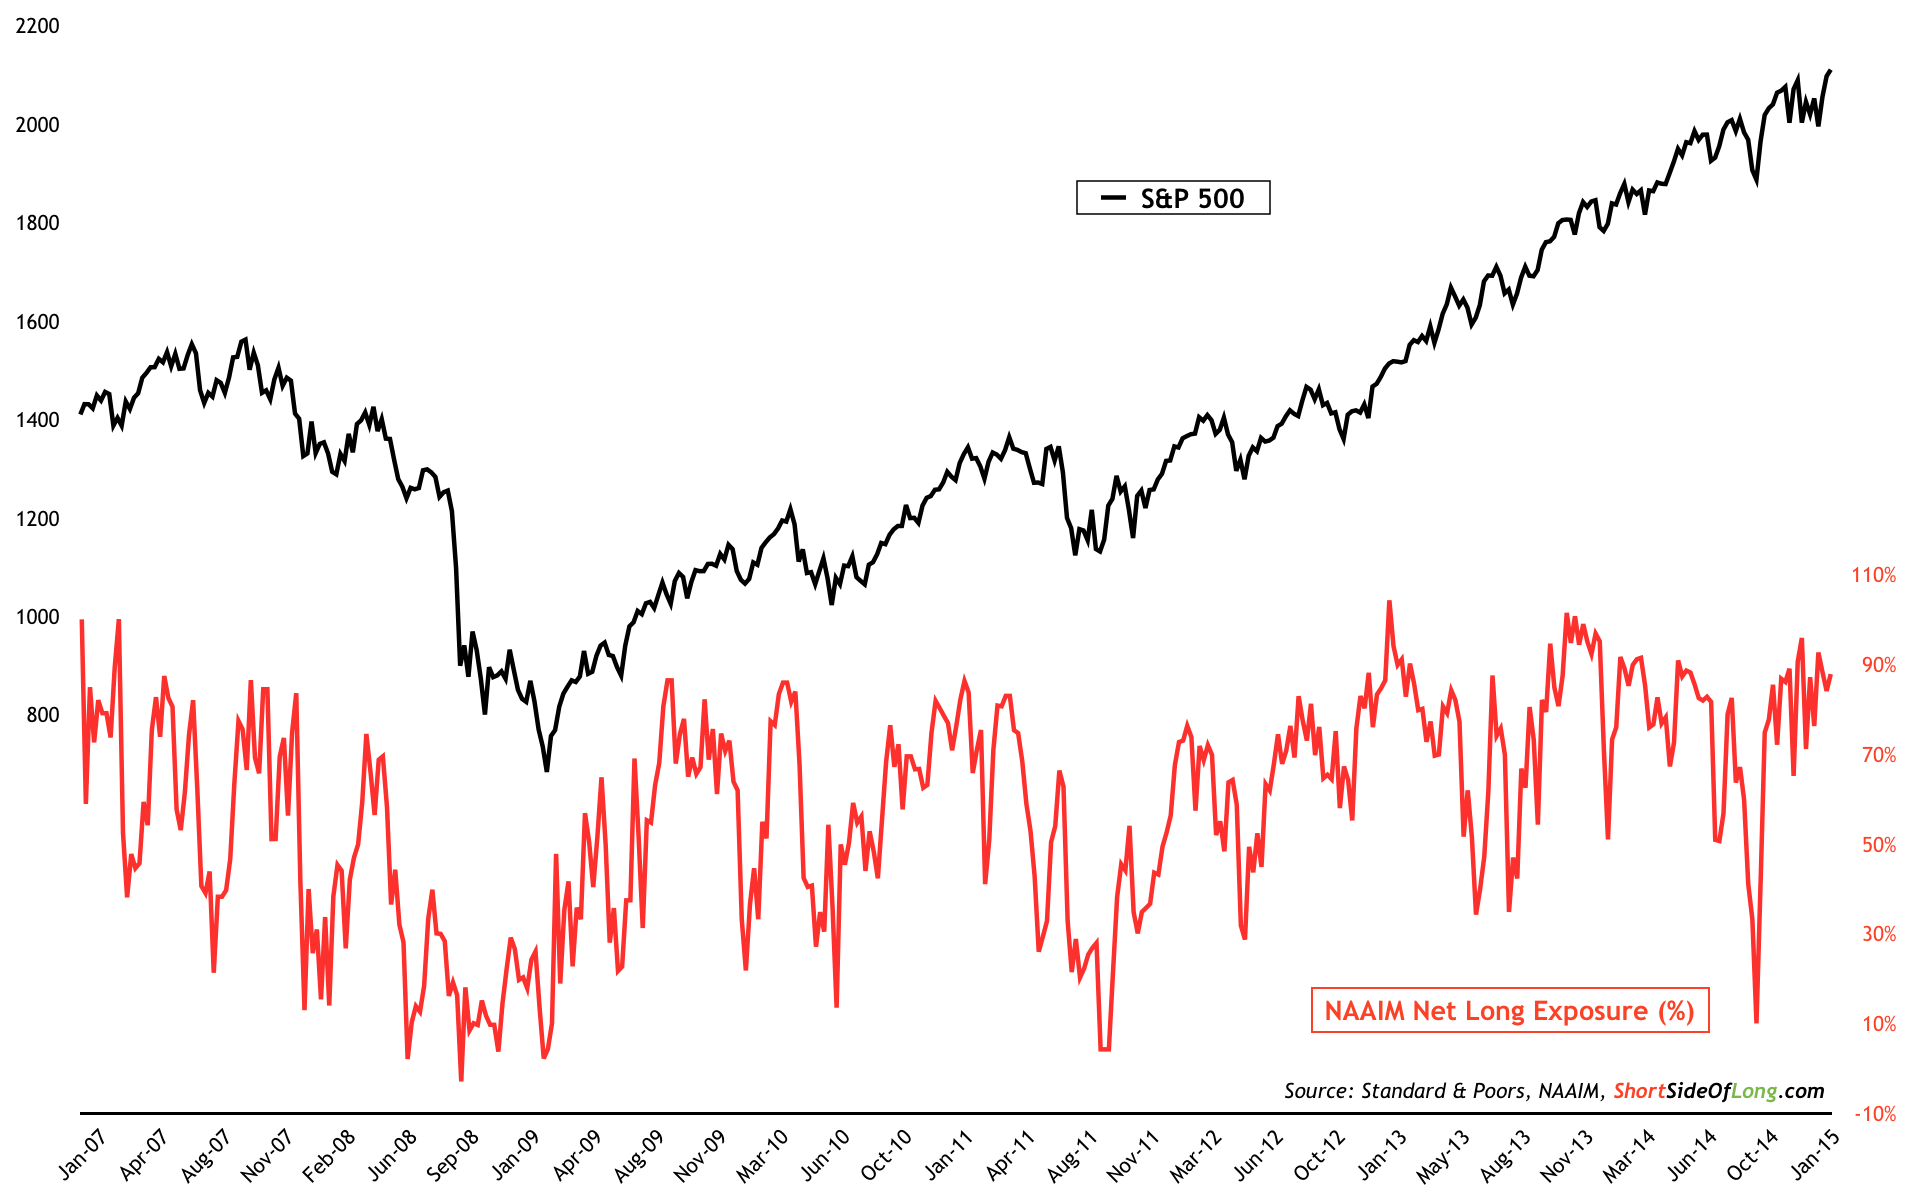
S&P 500 vs NAAIM Net Long Exposure 2007-Present
Contrarian investors should start to pay attention. Over the last several months, the NAAIM survey has been showing signs of extremely optimistic investor behaviour and it could be a dangerous signal. Since November of 2014, the average weekly reading for the survey was 83% net long, with the lowest level recorded at 65% (refer to Chart 1). This is a far cry from the levels seen during the recent intermediate bottom in October 2014, as exposure fell to only 10% net long.

Furthermore, the difference between the net long managers relative to those who are net short, has been skewed more and more towards the bullish side. This is especially true over the last month, where the intensity has averaged 200% - a maximum reading possible - signalling outright greed. This kind of persistent bullishness, usually but not always, results in a sharp and fast shake out. For those who are net long equities as of today, caution is advised!

Chart 2: overall positioning is very skewed towards the bullish side...
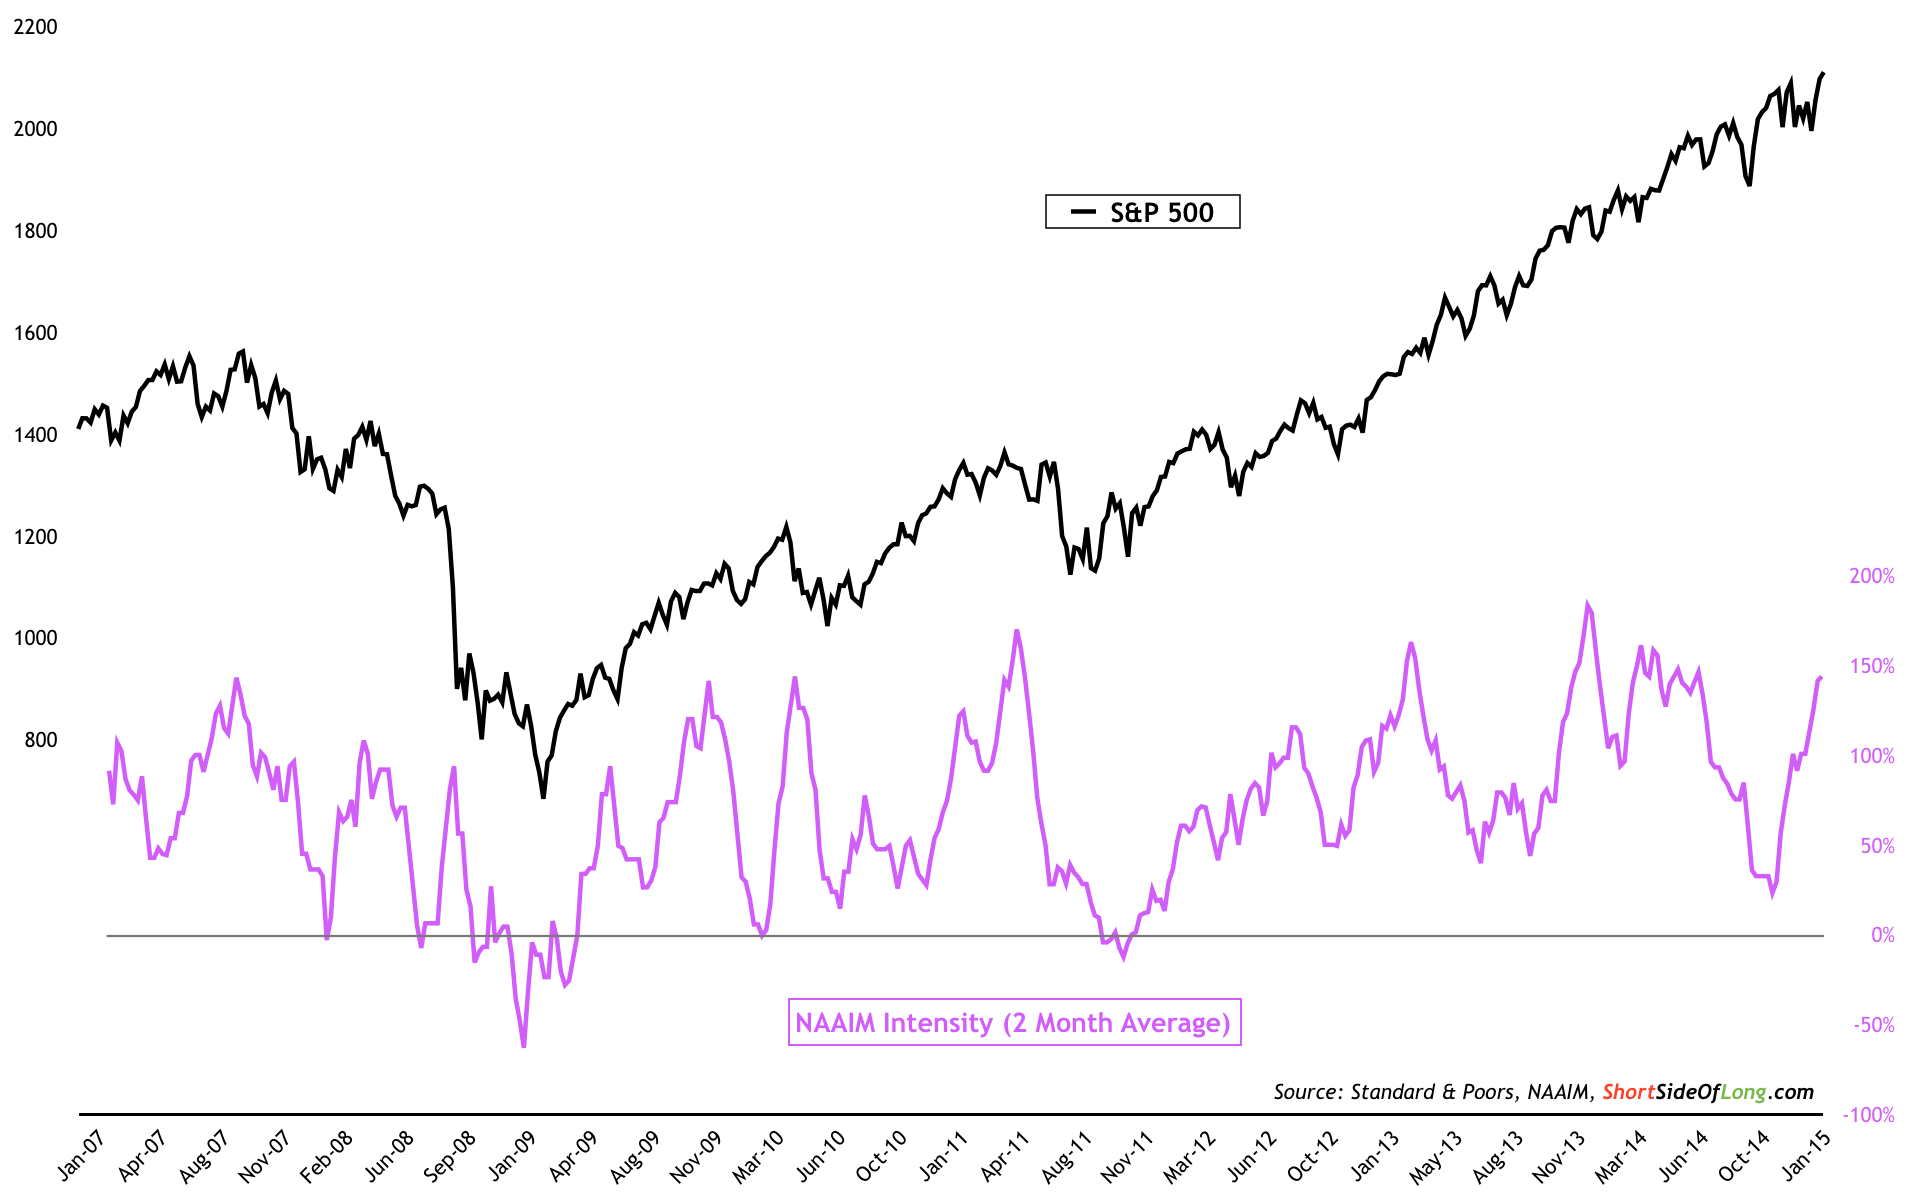
S&P 500 vs Intensity 2007-Present

Latest comments

Risk Disclosure: Trading in financial instruments and/or cryptocurrencies involves high risks including the risk of losing some, or all, of your investment amount, and may not be suitable for all investors. Prices of cryptocurrencies are extremely volatile and may be affected by external factors such as financial, regulatory or political events. Trading on margin increases the financial risks.
Before deciding to trade in financial instrument or cryptocurrencies you should be fully informed of the risks and costs associated with trading the financial markets, carefully consider your investment objectives, level of experience, and risk appetite, and seek professional advice where needed.
Fusion Media would like to remind you that the data contained in this website is not necessarily real-time nor accurate. The data and prices on the website are not necessarily provided by any market or exchange, but may be provided by market makers, and so prices may not be accurate and may differ from the actual price at any given market, meaning prices are indicative and not appropriate for trading purposes. Fusion Media and any provider of the data contained in this website will not accept liability for any loss or damage as a result of your trading, or your reliance on the information contained within this website.
It is prohibited to use, store, reproduce, display, modify, transmit or distribute the data contained in this website without the explicit prior written permission of Fusion Media and/or the data provider. All intellectual property rights are reserved by the providers and/or the exchange providing the data contained in this website.
Fusion Media may be compensated by the advertisers that appear on the website, based on your interaction with the advertisements or advertisers.
© 2007-2024 - Fusion Media Limited. All Rights Reserved.