Upcoming US Events for Today:
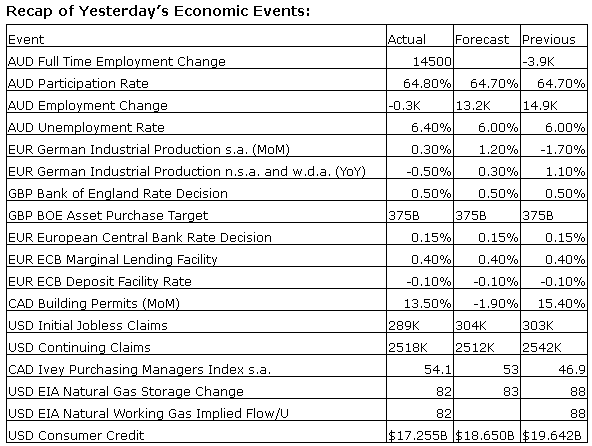
- Productivity and Costs for the Second Quarter will be released at 8:30am.The market expects Non-Farm Productivity to show a quarter=over-quarter increase of 1.4% versus a decline of 3.2% previous. Labour Costs are expected to show a quarter=over-quarter increase of 1.6% versus an increase of 5.7% previous.
- Wholesale Trade for June will be released at 10:00am. The market expects a month-over-month increase of 0.7% versus an increase of 0.5% previous.
Upcoming International Events for Today:
- China Trade Balance for July will be released. The market expects a surplus of $29.3B versus a surplus of $31.6B previous. Exports are expected to show a year-over-year increase of 7.3% versus an increase of 7.2% previous. Imports are expected to show a year-over-year increase of 1.2% versus an increase of 5.5% previous.
- German Merchandise Trade
- Great Britain Merchandise Trade
- Canadian Labour Force Survey for July will be released at 8:30am EST. The market expects employment to increase by 25,000 versus a decline of 9,400 previous. The Unemployment Rate is expected to decline to 7.0% versus 7.1% previous.
- China Consumer Price Index for July will be released at 9:30pm EST. The market expects a year-over-year increase of 2.3%, consistent with the previous report.
- China Producer Price Index for July will be released at 9:30am EST. The market expects a year-over-year decline of 0.8% versus a decline of 1.1% previous.
The Markets
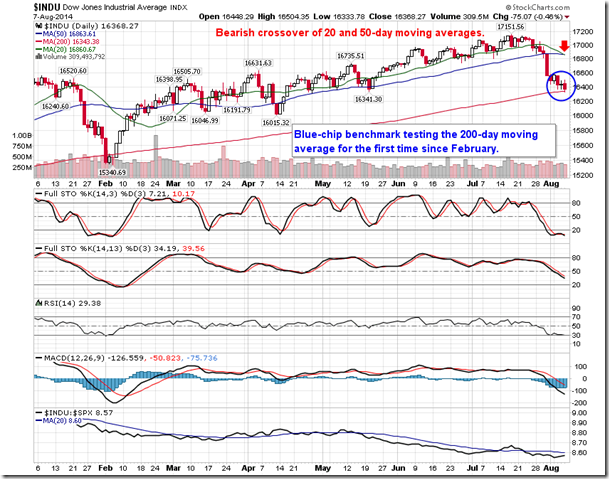
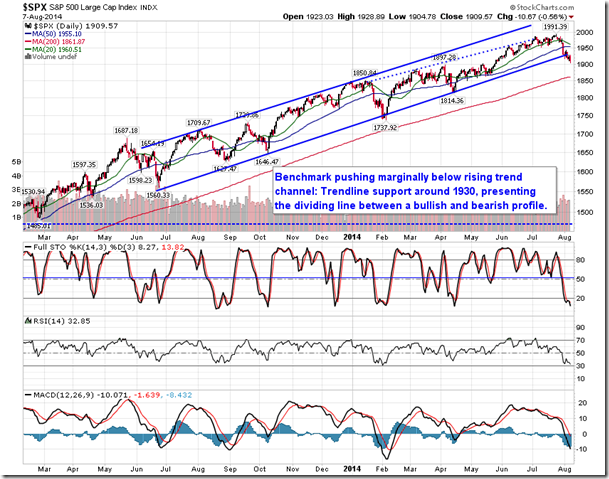
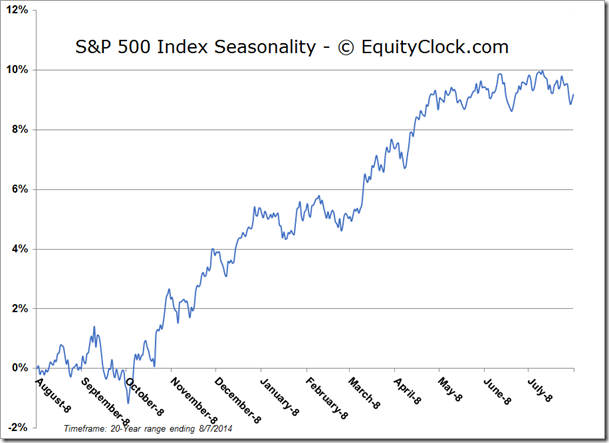
Stocks ended lower on Thursday as rising geopolitical tensions continue to pressure equity prices. Major US equity benchmarks declined around half of one percent, pushing the Dow 30 down to its 200-day moving average for the first time since February. The 20-day moving average of the blue-chip benchmark is moving below its 50-day average, otherwise known as a bearish crossover, an event that is often looked upon as confirmation of an intermediate down-trend. Major benchmarks continue to hover around oversold levels, however, concerning news events are preventing any rally attempts as investors hedge against headline risks. The Dow Jones Industrial Average currently sits with a year-to-date loss of 1.26%, significantly below the 18%+ return generated by this time last year. Seasonal volatility for the equity market continues through to October.
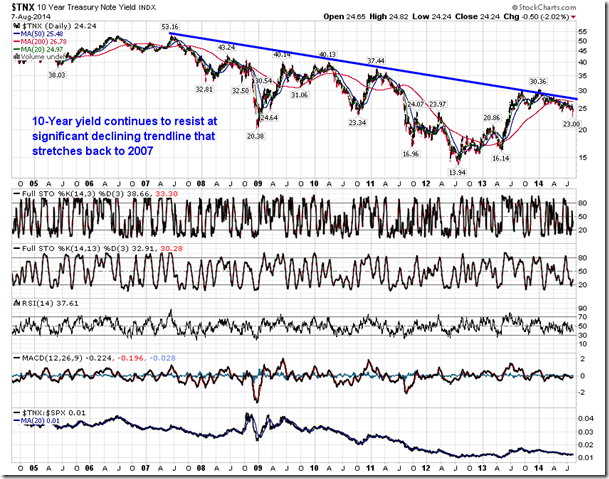
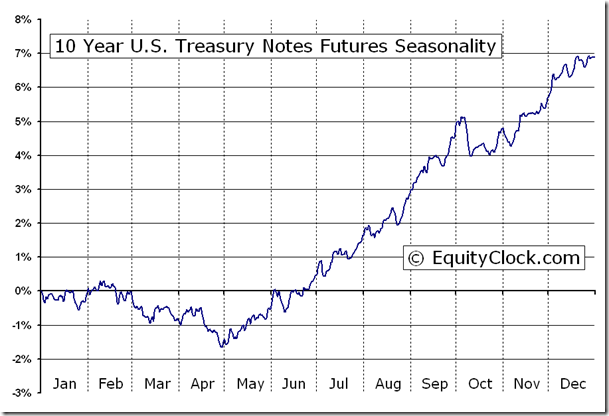
As investors flee risk in stocks, the bond market continues to remain positive with the 10-Year Treasury Bond Fund (ARCA:IEF) now up around 6.5% on the year. Despite calls for higher rates from many analysts as the Fed begins to tighten, the 10-Year Treasury Yield remains within a long-term down-trend, constrained by declining trendline resistance that stretches back to 2007; this level of resistance currently sits around 2.7%, a significant hurdle that if broken would finally confirm the end of the multi-year bull market in bonds. Bonds remain seasonally strong through to October.
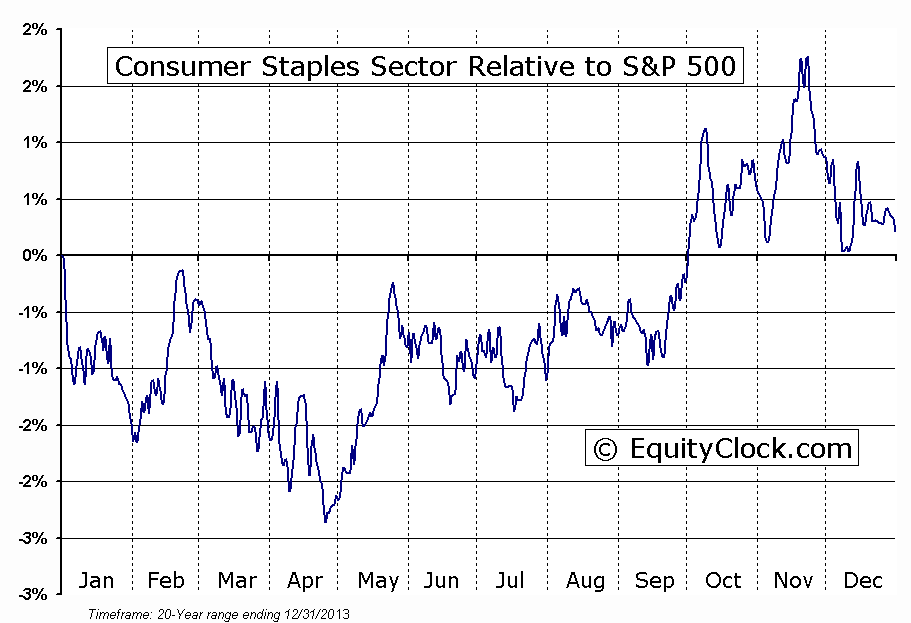
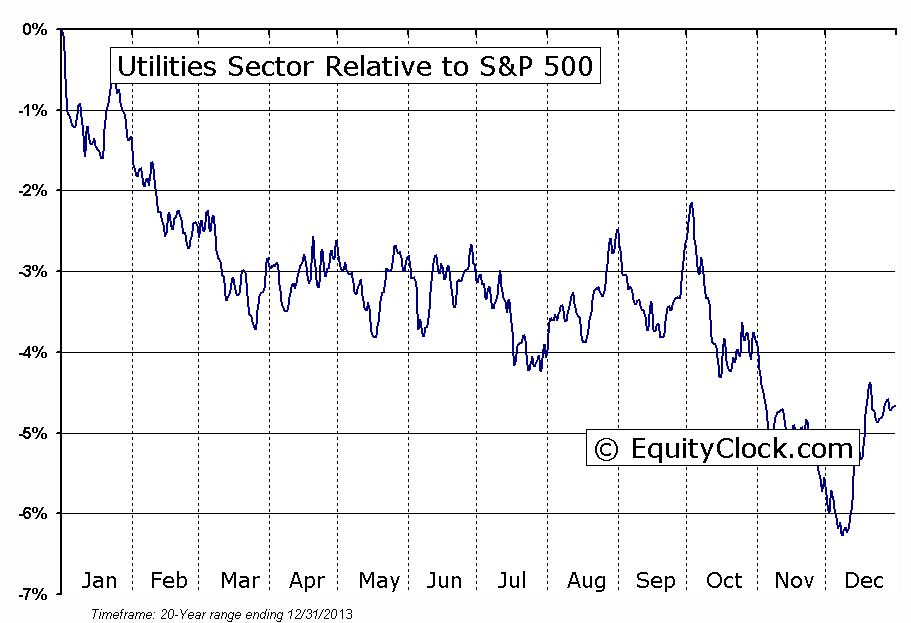
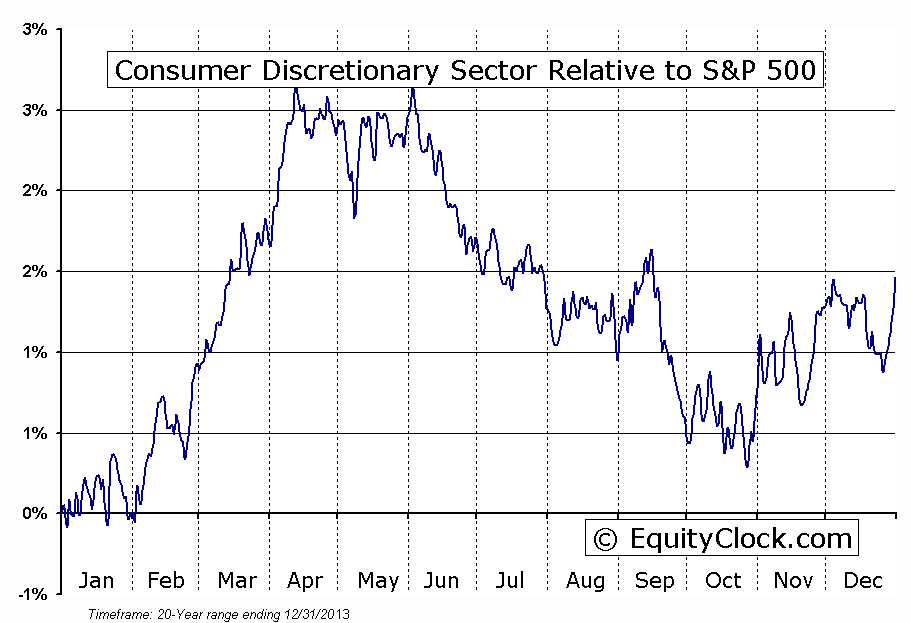
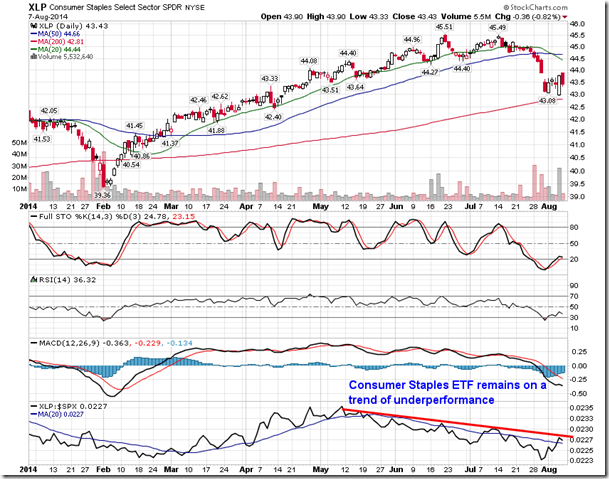
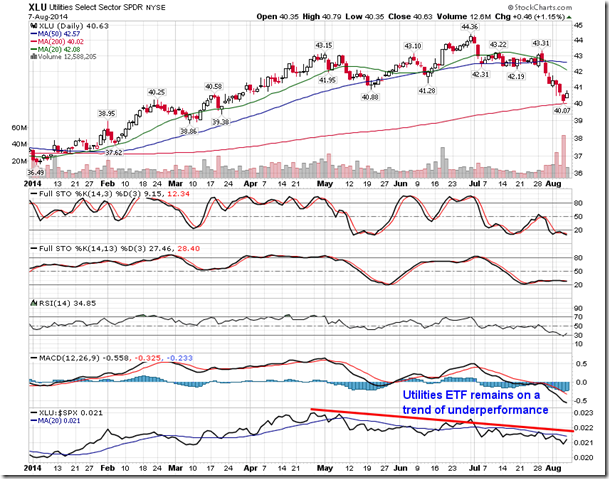
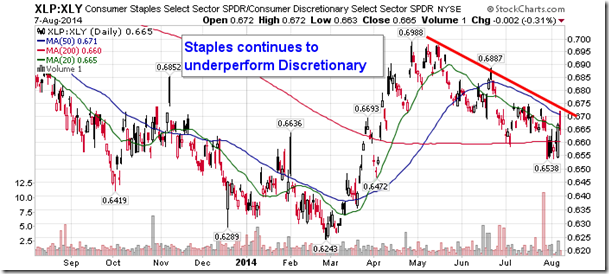
While strength in the bond market as stocks weaken is typical, the activity in some of the defensive equity sectors is not. Even with the significant broad market weakness realized over the past two weeks, Consumer Staples and Utilities, two defensive sectors that seasonally tend to outperform during the volatility that is typical for this time of year, continue on a path of underperformance. Investors commonly use these lower beta sectors as a place to hide, benefitting from appealing dividend yields that often hedge against significant market swings. The Consumer Staples ETF (SPDR - Consumer Staples (ARCA:XLP)) has underperformed the more cyclical Consumer Discretionary ETF (SPDR Consumer Discr. Select Sector (ARCA:XLY)) since the ratio peaked for the year in the month of May, typically the seasonal start of the risk aversion trade within the consumer sector. The Consumer Discretionary sector is presently showing a neutral trend relative to the market, bucking the typical weakness that negatively pressures stocks in this space though the summer months.
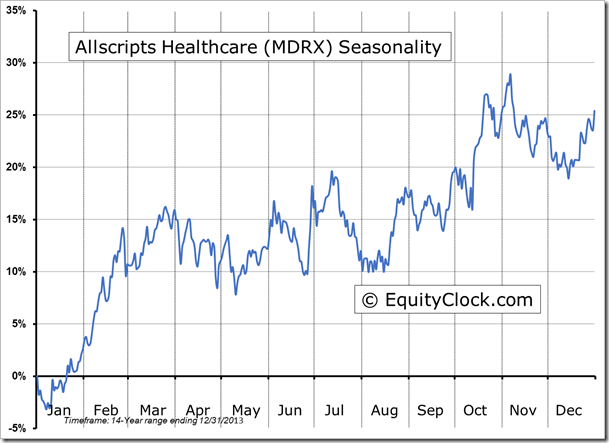
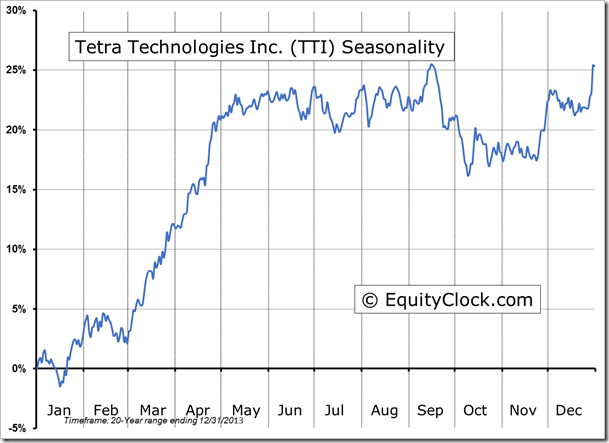
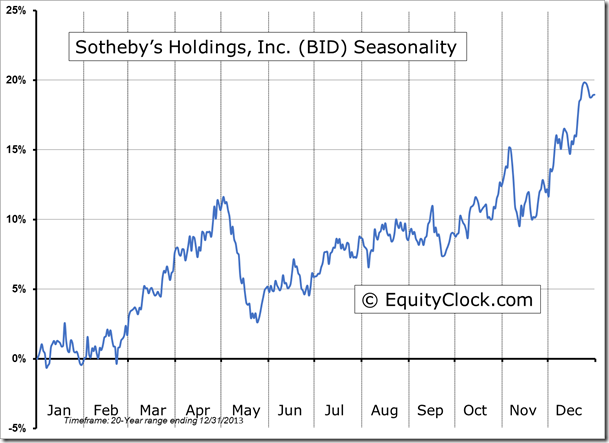
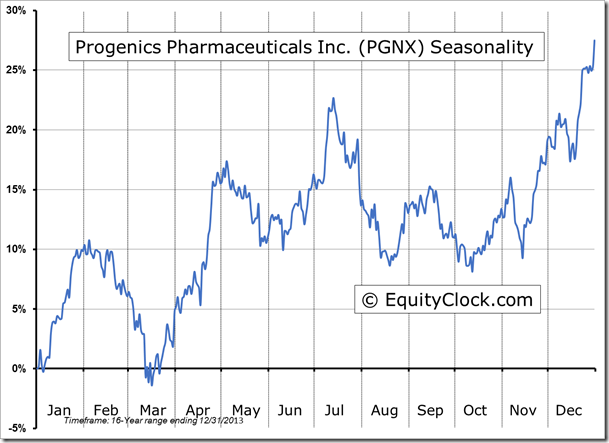
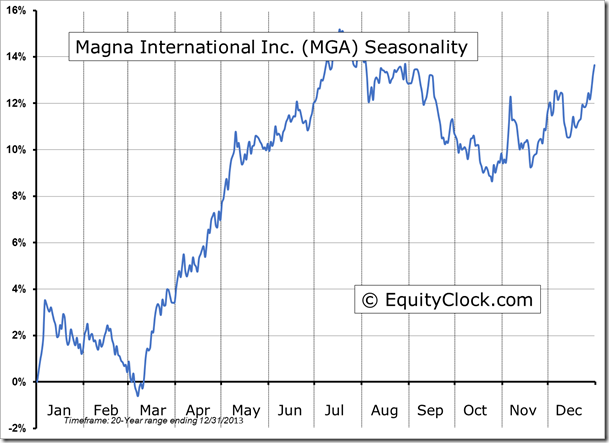
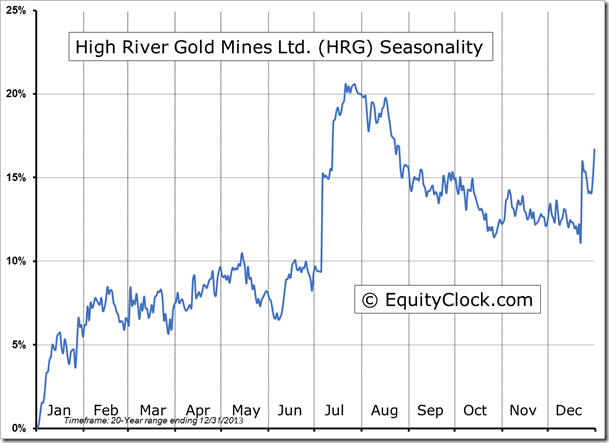
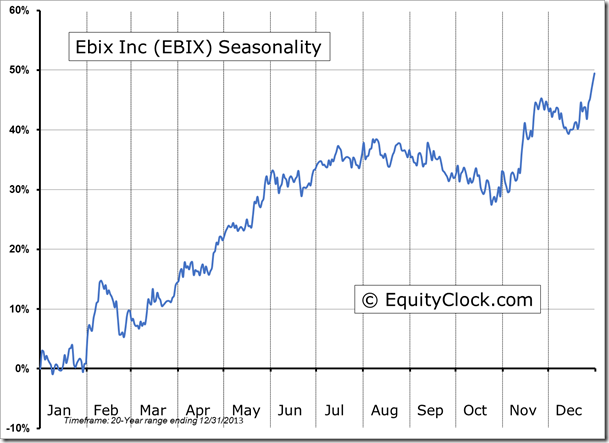
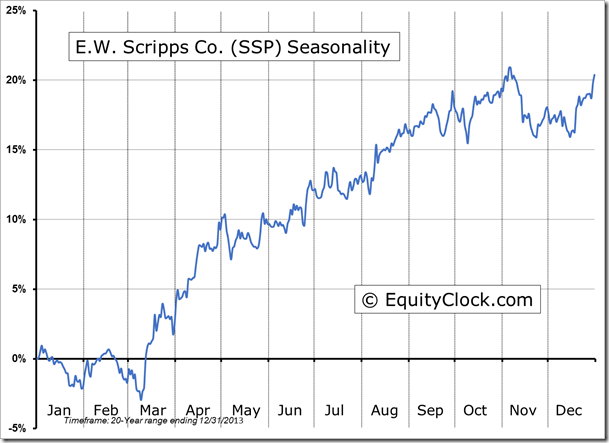
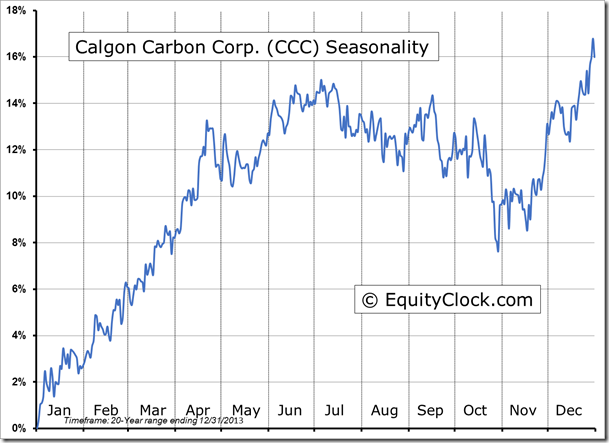
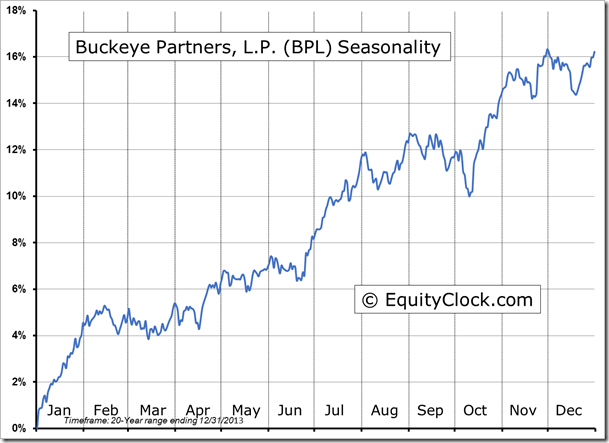
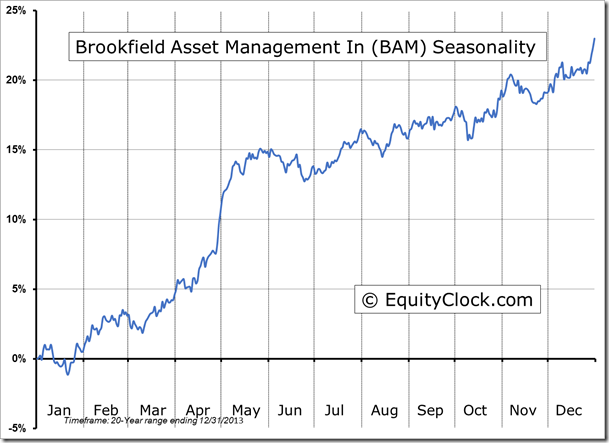
Seasonal charts of companies reporting earnings today:
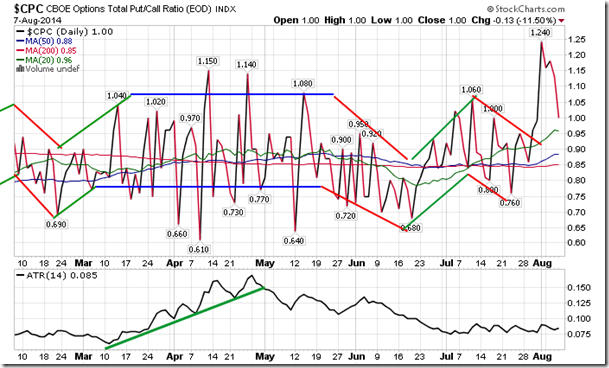
Sentiment on Thursday, as gauged by the put-call ratio, ended neutral at 1.00.
S&P 500 Index
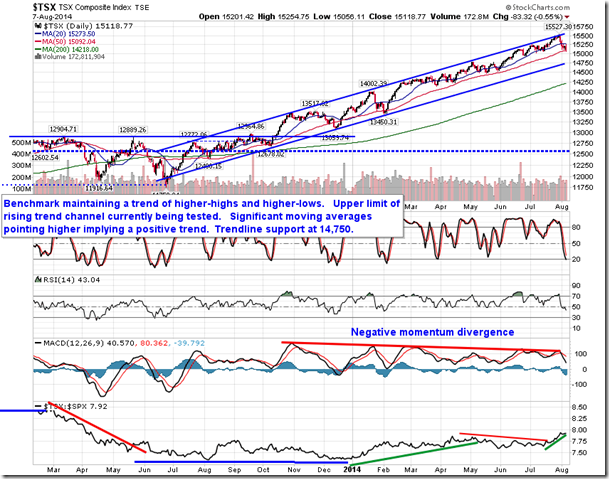
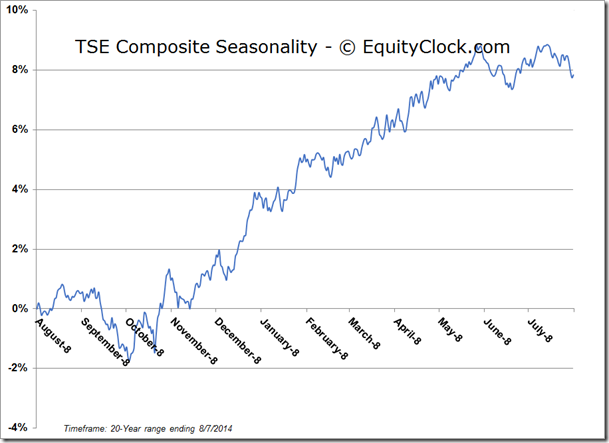
TSE Composite
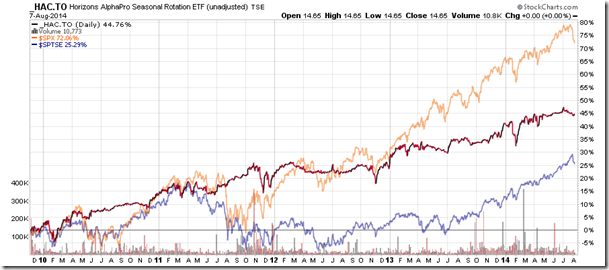
Horizons Seasonal Rotation ETF (Horizons Seasonal Rotation (TO:HAC))
- Closing Market Value: $14.65 (unchanged)
- Closing NAV/Unit: $14.65 (up 0.13%)
Performance*
| 2014 Year-to-Date | Since Inception (Nov 19, 2009) | |
| HAC.TO | 2.45% | 46.5% |
* performance calculated on Closing NAV/Unit as provided by custodian
