Today's Upcoming US Events
- PPI Final Demand for March will be released at 8:30am EST. The market expects a month-over-month increase of 0.1% versus a decline of 0.1% previous.
- Consumer Sentiment for April will be released at 9:55am EST. The market expects 81.0 versus 80.0 previous.
Upcoming International Events for Today:
- German CPI for March will be released at 2:00am EST. The market expects a year-over-year increase of 1% versus an increase of 1.2% previous.
The Markets
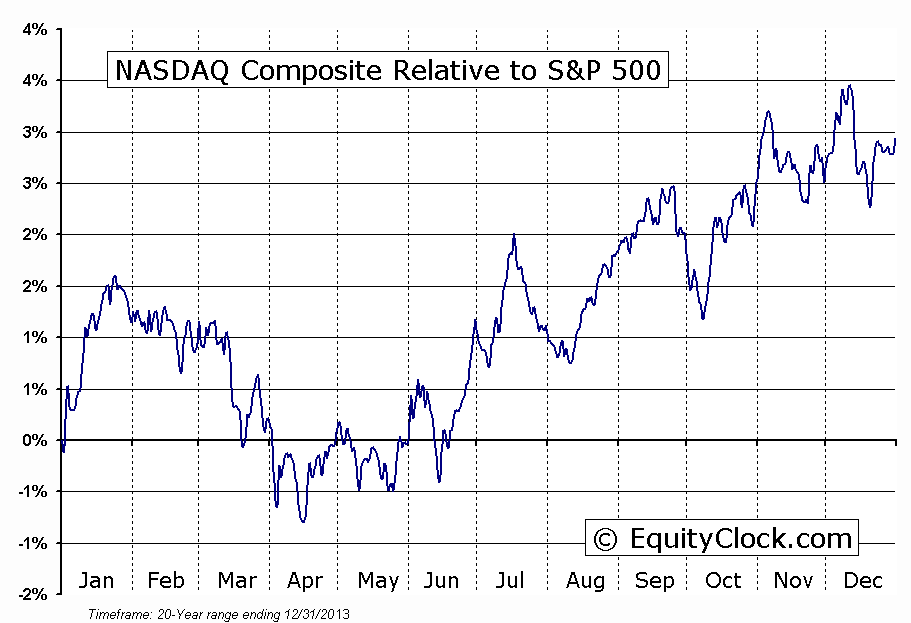
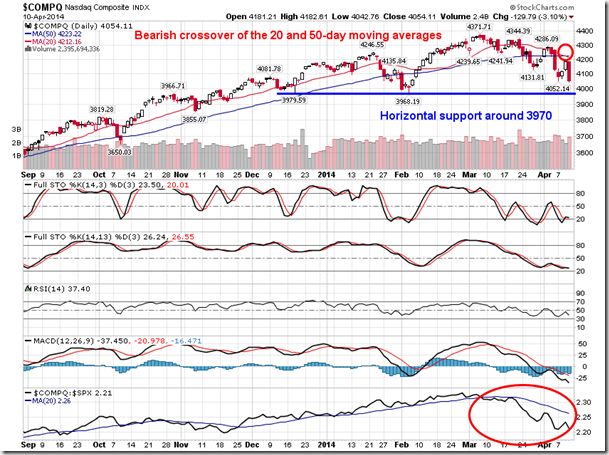
Stocks plunged on Thursday, once again weighed down by momentum securities. Major equity benchmarks, including the S&P 500 Index, Russel 2000 Small Cap Index and Dow Jones Transportation Average fell over 2% as investors rushed to the exits following Wednesday’s market rebound. The Nasdaq shed the most, ending 3.10% lower in the worst session for the benchmark since November of 2011. The Nasdaq Continues to be the weakest of the major US equity benchmarks, vastly underperforming the S&P 500 since the beginning of March and recently charting a bearish crossover with respect to the 20- and 50-day moving averages. The benchmark is approaching a key point of support around 3970, a break of which would see selling pressures escalate. Seasonal tendencies for the Nasdaq remain negative through to mid-April.
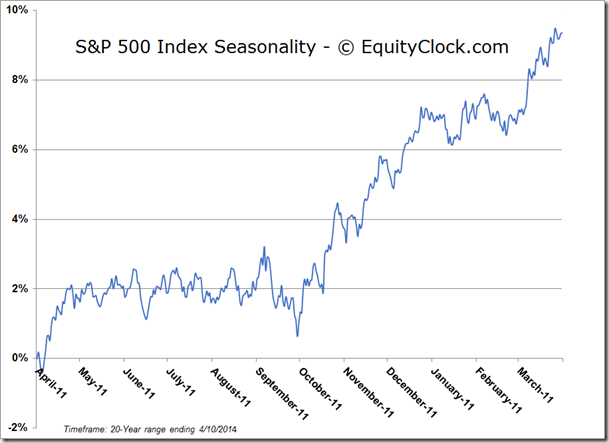
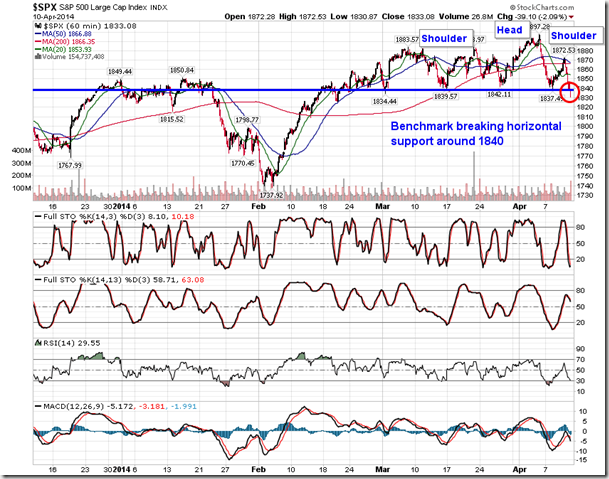
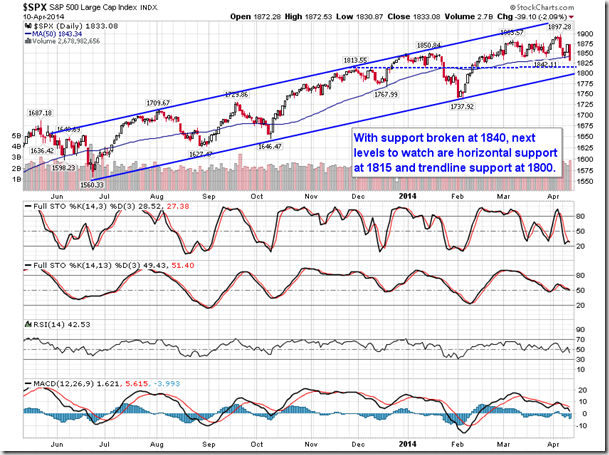
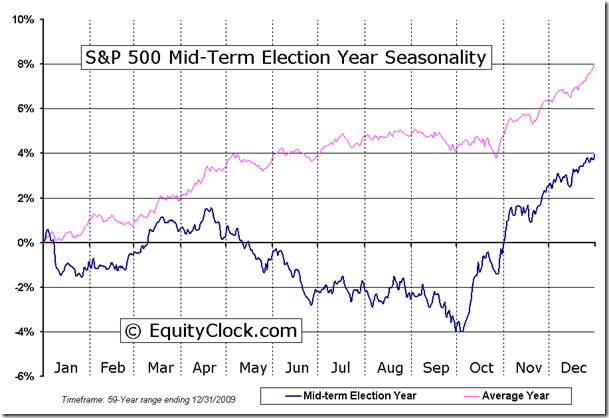
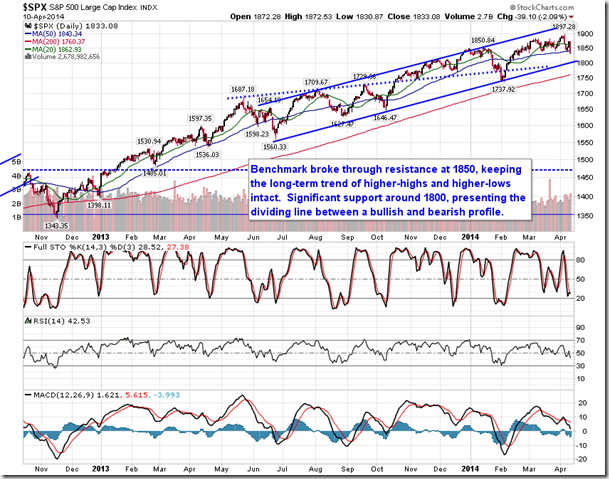
Turning to the S&P 500 Index, the large cap benchmark broke through an important level of short-term horizontal support at 1840. This level had kept the benchmark afloat, in positive territory for the year, during the past month and a half. The same can be said of the 50-day moving average, which was also lost as support during Thursday’s tough session. The next level to watch is horizontal support at 1815, followed by trendline support at 1800. The now broken support at 1840 also resembles the neckline of a bearish head-and-shoulders topping pattern, which suggests a downside target of 1785, or 2.6% lower than Thursday’s close. Warning signs of market decline have been prominent over the last month, including the loss of positive momentum, the pronounced decline in high beta assets, the recent risk aversion, and the heightened volatility, all of which suggests a shift away from the strong bull run that benefitted stocks throughout 2013. Significant tops are a process and it will take some time to confirm a peak. However, equity markets are within the timeframe when a seasonal peak is typically realized. On average, mid-term election years peak in the month of April, sooner than the notorious “sell in May” date; declines during equivalent years span from April through to October.
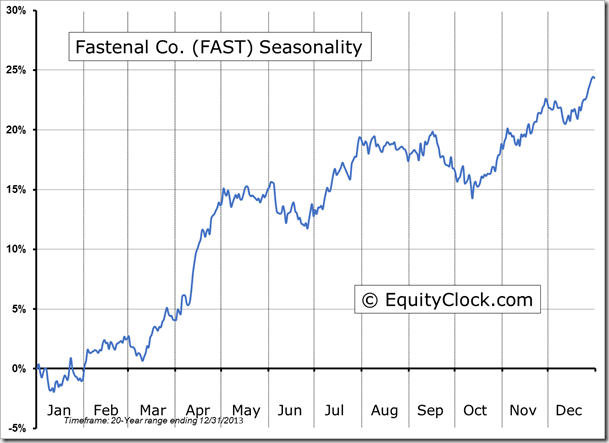
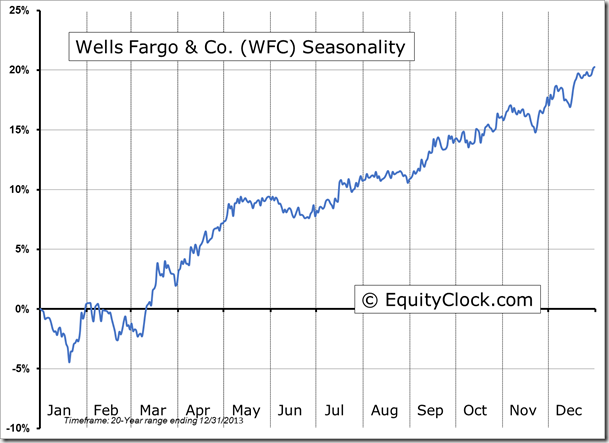
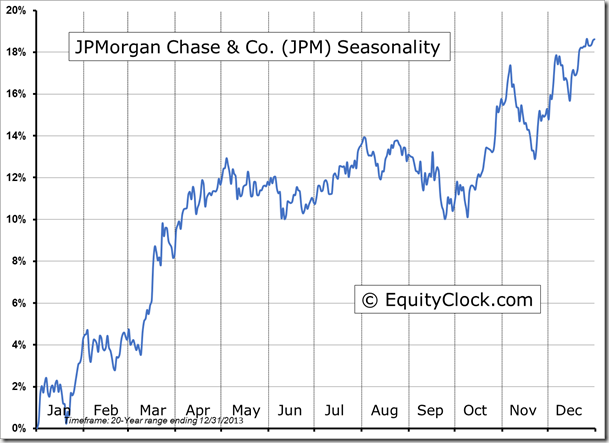
Seasonal charts of companies reporting earnings today:
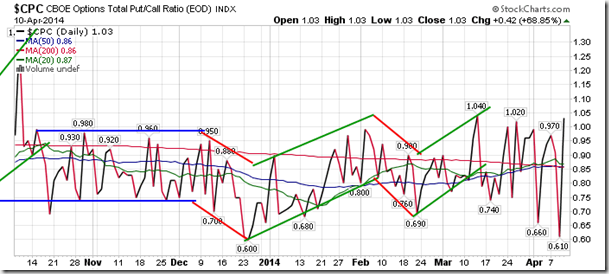
Sentiment on Thursday, as gauged by the put-call ratio, ended bearish at 1.03.
S&P 500 Index
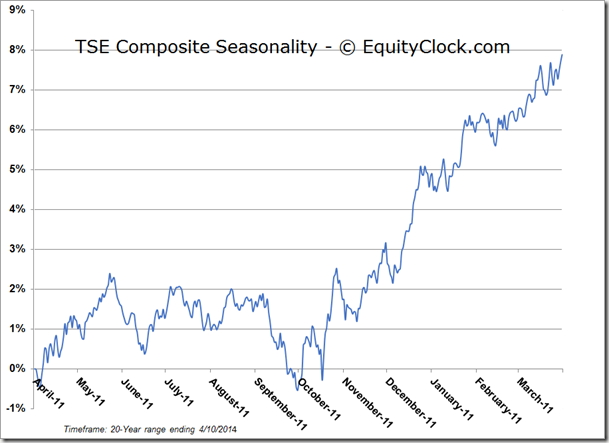
TSE Composite
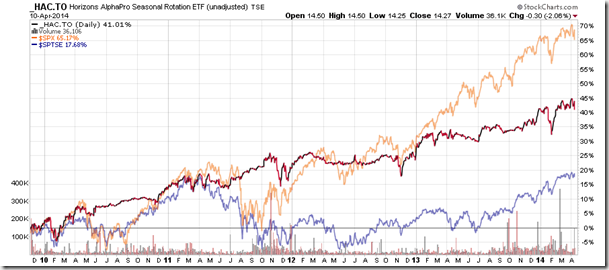
Horizons Seasonal Rotation (HAC.TO)
- Closing Market Value: $14.27 (down 2.06%)
- Closing NAV/Unit: $14.31 (down 1.60%)
Performance*
| 2014 Year-to-Date | Since Inception (Nov 19, 2009) | |
| HAC.TO | 0.07% | 43.1% |
* performance calculated on Closing NAV/Unit as provided by custodian

