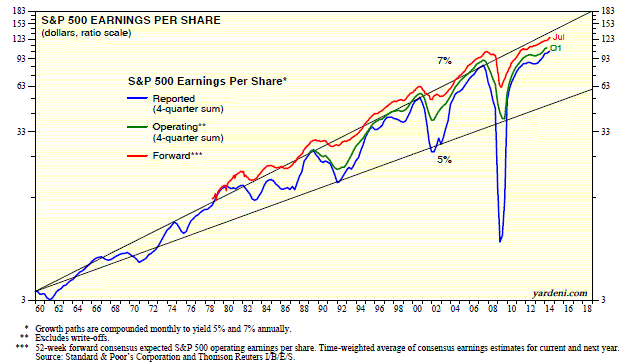
There are numerous measures of corporate profits. The National Income and Product Accounts (NIPA), which cover GDP, also include profits data on a pre-tax and after-tax basis. The NIPA data also show profits as reported to the IRS and on a cash flow basis, i.e., from “current production.” Of course, both tend to follow the trend in nominal GDP. Since 1960, profits and GDP have fluctuated around a long-term uptrend line growing at a 7% compounded annual rate.
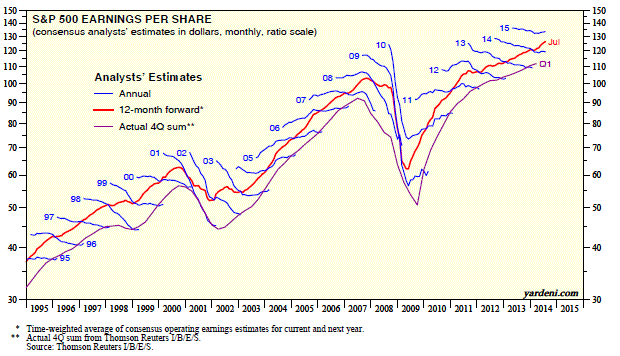
S&P 500 earnings tend to fluctuate between long-term growth uptrend lines of 5% and 7%. That’s especially the case for actual four-quarter trailing earnings on both a reported and operating basis. Forward earnings tends to fluctuate around the 7% trend line. During 2009 and 2010, it rebounded back to this uptrend line following a steep drop in 2008. Since early 2011, it has been tracking the 7% uptrend line closely. In recent weeks, it’s been showing signs of faster growth.
As long as the economy continues to grow, forward earnings should continue to provide a good tailwind for the stock market. S&P 500 forward earnings tends to be a good leading indicator of actual operating earnings over the coming year when the economy is growing.
Today's Morning Briefing: Earnings Tuesday. (1) Earnings are still growing. (2) Another setup for positive earnings surprises. (3) All measures of profits on uptrends. (4) The magic long-term growth number is 7%. (5) Earnings providing tailwind for stock market. (6) Revenue estimates rising for S&P 500. (7) Broad-based upturn in revenues and earnings for the 10 sectors. (8) IT outperforming, while consumer sectors underperforming so far this year. (9) Financials are cheap. (10) Still recommending overweighting in Financials, Health Care, Industrials, and IT sectors.
3rd party Ad. Not an offer or recommendation by Investing.com. See disclosure here or
remove ads
.


