
Fortinet Inc. (NASDAQ:FTNT) reported better-than-expected results for second-quarter 2016, wherein both the top line and bottom line outpaced the respective Zacks Consensus Estimate. The network security solution provider’s adjusted earnings per share (excluding one-time items but including stock-based compensation) came in at 3 cents, while the Zacks Consensus Estimate stood a tad lower at 2 cents.
However, on a year-over-year basis, the company reported earnings remained flat, while on a GAAP basis, it reported a loss of a penny, compared with breakeven results in the year-ago quarter.
Revenues
Fortinet reported second-quarter revenues of $311.4 million, up 29.9%. Revenues also beat the Zacks Consensus Estimate of $304 million and exceeded the company’s guidance of $301–$306 million. Segment-wise, Product revenues jumped 19% year over year to $136.6 million, while Services revenues surged 40% to $174.8 million.
The year-over-year improvement was primarily aided by strength in the network security market. A large number of deal wins and customer additions during the quarter further contributed to top–line growth.
During the quarter, Fortinet added approximately 9,000 customers, bringing the total count to over 280,000. The company witnessed 36% year-over-year growth in the number of deals worth over $100,000, while the number of deals worth over $250,000 and $500,000 increased 35% and 19%, respectively.
Billings soared 26% on a year-over-year basis to $373.8 million.
Operating Results
Gross profit increased 33.2% from the year-ago quarter to $226.9 million. Moreover, gross margin expanded 190 basis points (bps) to 72.7% primarily backed by sales of higher-value subscription bundles.
Higher-than-expected adjusted operating expenses (up 35.9% year over year) hurt operating results. As a percentage of revenues, operating expenses increased 320 bps to 71.1%. Adjusted operating profit during the quarter came in at $5.6 million, lower than the year-ago quarter profit level of $7.5 million.
Balance Sheet & Cash Flow
Fortinet exited the quarter with cash and cash equivalents, and short-term investments of approximately $984.8 million, up from $952.6 million at the end of the previous quarter. Accounts receivable were $254.4 million, compared with $220.1 million at the end of the first quarter.
During the quarter, the company generated cash flow of $67.9 million. Free cash flow for the quarter came in at $53.5 million. In first half of 2016, the company generated operating cash flow of $168.5 million.
During the first six months of 2016, Fortinet repurchased 2 million shares worth $50.0 million. However, during the second quarter, the company did not repurchase any stock.
Guidance
For the third quarter, management expects revenues in the range of $319–$324 million and non-GAAP earnings per share of 17–18 cents. The Zacks Consensus Estimate for revenues and earnings are pegged at $318.9 million and 7 cents, respectively. Billings are expected in the range of $372 million to $376 million in the third quarter. Non-GAAP gross margin is expected to be 73–74%, whereas non-GAAP operating margin is expected to be between 14% and 15%.
Fortinet has raised its 2016 revenue and billing guidance. The company now expects revenues in the range of $1.274 billion to $1.284 billion (previous projection: $1.262–$1.272 billion), representing a year-over-year improvement of 27%. The guided range also lies above the Zacks Consensus Estimate of $1.27 billion.
Billings are now projected in the range of $1.530 billion to $1.540 billion, up from the earlier expectations of $1.520–$1.530 billion.
However, the company maintained its guidance for earnings. During its first-quarter earnings conference call, Fortinet had anticipated earnings for the full year to be between 69 cents and 71 cents.
FORTINET INC Price, Consensus and EPS Surprise
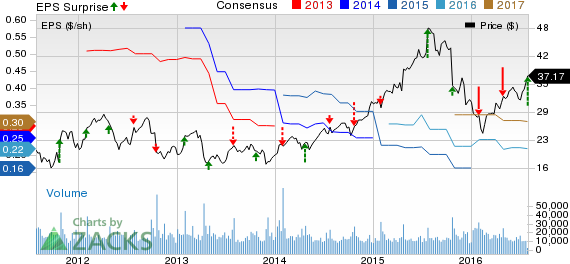
FORTINET INC Price, Consensus and EPS Surprise | FORTINET INC Quote
Conclusion
Fortinet’s network security solutions include firewall, VPN, application control, antivirus, intrusion prevention, web filtering, anti-spam and WAN acceleration. The company reported better-than-expected second-quarter results. Despite persistent macro uncertainties, management seems to be positive on the back of a healthy network security market, solid product line-up and investment plans.
However, competition from key network security players such as Cisco Systems Inc. (NASDAQ:CSCO) , Check Point (NASDAQ:CHKP) , Juniper Networks (NYSE:JNPR) and Palo Alto Networks, remains a concern. Nonetheless, product ramp-ups, deal wins, continuous growth in the network security market and expected benefits from the ongoing investments should provide ample tailwinds.
Currently, Fortinet has a Zacks Rank #4 (Sell).
CISCO SYSTEMS (CSCO): Free Stock Analysis Report
FORTINET INC (FTNT): Free Stock Analysis Report
JUNIPER NETWRKS (JNPR): Free Stock Analysis Report
CHECK PT SOFTW (CHKP): Free Stock Analysis Report
Original post
Zacks Investment Research