

US Dollar spec positioning falls but continues to have bullish sentiment versus all Major Currencies
The latest data for the weekly Commitment of Traders (COT) report, released by the Commodity Futures Trading Commission (CFTC) on Friday, showed that large traders and currency speculators cut back on their overall US dollar bullish bets for a second consecutive week.
Non-commercial large futures traders, including hedge funds and large speculators, had an overall US dollar long position totaling $42.19 billion as of Tuesday December 9th, according to the latest data from the CFTC and dollar amount calculations by Reuters. This was a weekly change of -$5.19 billion from the $47.38 billion total long position that was registered on December 2nd, according to the Reuters calculation that totals the US dollar contracts against the combined contracts of the euro, British pound, Japanese yen, Australian dollar, Canadian dollar and the Swiss franc.
The US dollar’s decline last week was the largest weekly fall since March but still saw the overall bullish position above the +$40 billion level for a tenth straight week. All the other individually tracked currencies also continued to have a net bearish position versus the dollar for a tenth straight week.
Overall Speculative Net US Dollar Contracts
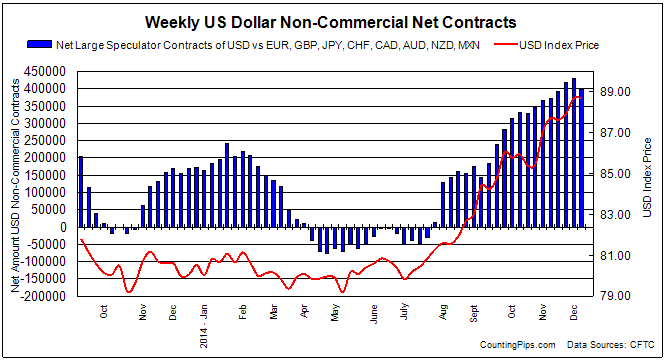
In terms of total net speculative contracts, overall US dollar contracts fell for the first time in seven weeks last week to a total of +397,011 contracts as of Tuesday December 9th. This was a change by -31,547 contracts from the total of +428,558 contracts as of Tuesday December 2nd. This total US dollar contracts calculation takes into account more currencies than the Reuters dollar amount total and is derived by adding the sum of each individual currencies net position versus the dollar. Currency contracts used in the calculation are the EUR, GBP, JPY, CHF, CAD, AUD, NZD and the MXN.
Major Currency Weekly Levels & Changes: One Sided – All currencies have net bearish position versus the USD for 10th week

Overall changes on the week for the major currencies showed that large speculators increased their bets last week in favor of the euro, British pound sterling, Japanese yen, Swiss franc and the Canadian dollar while decreasing weekly bets for the Australian dollar, New Zealand dollar and the Mexican Peso.
This latest COT data is through Tuesday December 9th and shows a quick view of how large speculators and for-profit traders (non-commercials) were positioned in the futures markets. All currency positions are in direct relation to the US dollar where, for example, a bet for the euro is a bet that the euro will rise versus the dollar while a bet against the euro will be a bet that the dollar will gain versus the euro.
Please see the individual currency charts and their respective data points below.
Weekly Charts: Large Speculators Weekly Positions vs Currency Spot Price
EuroFX:

Last Six Weeks data for EuroFX futures
| Date | Open Interest | Long Specs | Short Specs | Large Specs Net | Weekly Change |
| 11/04/2014 | 465332 | 59566 | 238587 | -179021 | -13314 |
| 11/11/2014 | 463976 | 60454 | 224347 | -163893 | 15128 |
| 11/18/2014 | 465168 | 58048 | 226778 | -168730 | -4837 |
| 11/25/2014 | 465339 | 57982 | 223062 | -165080 | 3650 |
| 12/02/2014 | 462058 | 57272 | 216551 | -159279 | 5801 |
| 12/09/2014 | 477861 | 58306 | 195218 | -136912 | 22367 |
British Pound Sterling:

Last Six Weeks data for Pound Sterling futures
| Date | Open Interest | Long Specs | Short Specs | Large Specs Net | Weekly Change |
| 11/04/2014 | 144215 | 43289 | 50751 | -7462 | -1215 |
| 11/11/2014 | 151660 | 40661 | 53552 | -12891 | -5429 |
| 11/18/2014 | 166966 | 42865 | 65694 | -22829 | -9938 |
| 11/25/2014 | 171730 | 38541 | 69207 | -30666 | -7837 |
| 12/02/2014 | 174875 | 38556 | 69570 | -31014 | -348 |
| 12/09/2014 | 192104 | 37695 | 61297 | -23602 | 7412 |
Japanese Yen:

Last Six Weeks data for Yen Futures
| Date | Open Interest | Long Specs | Short Specs | Large Specs Net | Weekly Change |
| 11/04/2014 | 207974 | 37917 | 109568 | -71651 | -4252 |
| 11/11/2014 | 227576 | 47271 | 129834 | -82563 | -10912 |
| 11/18/2014 | 238898 | 46612 | 139066 | -92454 | -9891 |
| 11/25/2014 | 253976 | 46304 | 150684 | -104380 | -11926 |
| 12/02/2014 | 257828 | 41530 | 152690 | -111160 | -6780 |
| 12/09/2014 | 279859 | 38067 | 142203 | -104136 | 7024 |
Swiss Franc:

Last Six Weeks data for Franc futures
| Date | Open Interest | Long Specs | Short Specs | Large Specs Net | Weekly Change |
| 11/04/2014 | 59699 | 7844 | 28065 | -20221 | 62 |
| 11/11/2014 | 61280 | 8752 | 31427 | -22675 | -2454 |
| 11/18/2014 | 60718 | 9142 | 31258 | -22116 | 559 |
| 11/25/2014 | 61037 | 8153 | 31577 | -23424 | -1308 |
| 12/02/2014 | 63659 | 8628 | 31550 | -22922 | 502 |
| 12/09/2014 | 78496 | 8971 | 31068 | -22097 | 825 |
Canadian Dollar:

Last Six Weeks data for Canadian dollar futures
| Date | Open Interest | Long Specs | Short Specs | Large Specs Net | Weekly Change |
| 11/04/2014 | 104720 | 29627 | 49042 | -19415 | 1990 |
| 11/11/2014 | 108445 | 32668 | 54514 | -21846 | -2431 |
| 11/18/2014 | 106914 | 32082 | 51599 | -19517 | 2329 |
| 11/25/2014 | 102393 | 32106 | 48447 | -16341 | 3176 |
| 12/02/2014 | 101752 | 28533 | 46922 | -18389 | -2048 |
| 12/09/2014 | 109650 | 33406 | 47768 | -14362 | 4027 |
Australian Dollar:

Last Six Weeks data for Australian dollar futures
| Date | Open Interest | Long Specs | Short Specs | Large Specs Net | Weekly Change |
| 11/04/2014 | 123342 | 14595 | 52863 | -38268 | -4417 |
| 11/11/2014 | 123726 | 12896 | 50923 | -38027 | 241 |
| 11/18/2014 | 117859 | 9522 | 47124 | -37602 | 425 |
| 11/25/2014 | 127008 | 12050 | 56138 | -44088 | -6486 |
| 12/02/2014 | 133675 | 13565 | 54675 | -41110 | 2978 |
| 12/09/2014 | 159287 | 17378 | 62391 | -45013 | -3903 |
New Zealand Dollar:

Last Six Weeks data for New Zealand dollar futures
| Date | Open Interest | Long Specs | Short Specs | Large Specs Net | Weekly Change |
| 11/04/2014 | 23716 | 9737 | 13846 | -4109 | -211 |
| 11/11/2014 | 19809 | 9244 | 10233 | -989 | 3120 |
| 11/18/2014 | 19907 | 9134 | 10381 | -1247 | -258 |
| 11/25/2014 | 21096 | 9630 | 11924 | -2294 | -1047 |
| 12/02/2014 | 20448 | 9272 | 10952 | -1680 | 614 |
| 12/09/2014 | 23550 | 9786 | 12081 | -2295 | -615 |
Mexican Peso:

Last Six Weeks data for Mexican Peso futures
| Date | Open Interest | Long Specs | Short Specs | Large Specs Net | Weekly Change |
| 11/04/2014 | 159857 | 30218 | 56808 | -26590 | 253 |
| 11/11/2014 | 167364 | 29393 | 59067 | -29674 | -3084 |
| 11/18/2014 | 167389 | 31305 | 60339 | -29034 | 640 |
| 11/25/2014 | 176125 | 26386 | 58938 | -32552 | -3518 |
| 12/02/2014 | 191208 | 30210 | 73214 | -43004 | -10452 |
| 12/09/2014 | 213159 | 32116 | 80710 | -48594 | -5590 |
*COT Report: The weekly commitment of traders report summarizes the total trader positions for open contracts in the futures trading markets. The CFTC categorizes trader positions according to commercial hedgers (traders who use futures contracts for hedging as part of the business), non-commercials (large traders who speculate to realize trading profits) and nonreportable traders (usually small traders/speculators).
The Commitment of Traders report is published every Friday by the Commodity Futures Trading Commission (CFTC) and shows futures positions data that was reported as of the previous Tuesday (3 days behind).
Each currency contract is a quote for that currency directly against the U.S. dollar, a net short amount of contracts means that more speculators are betting that currency to fall against the dollar and a net long position expect that currency to rise versus the dollar.