Get 40% Off
🚨 Volatile Markets? Find Hidden Gems for Serious OutperformanceFind Stocks Now

EUR/USD: Best Trading Strategies

Published 05/23/2016, 10:00 AM
Updated 07/09/2023, 06:31 AM

EUR/USD

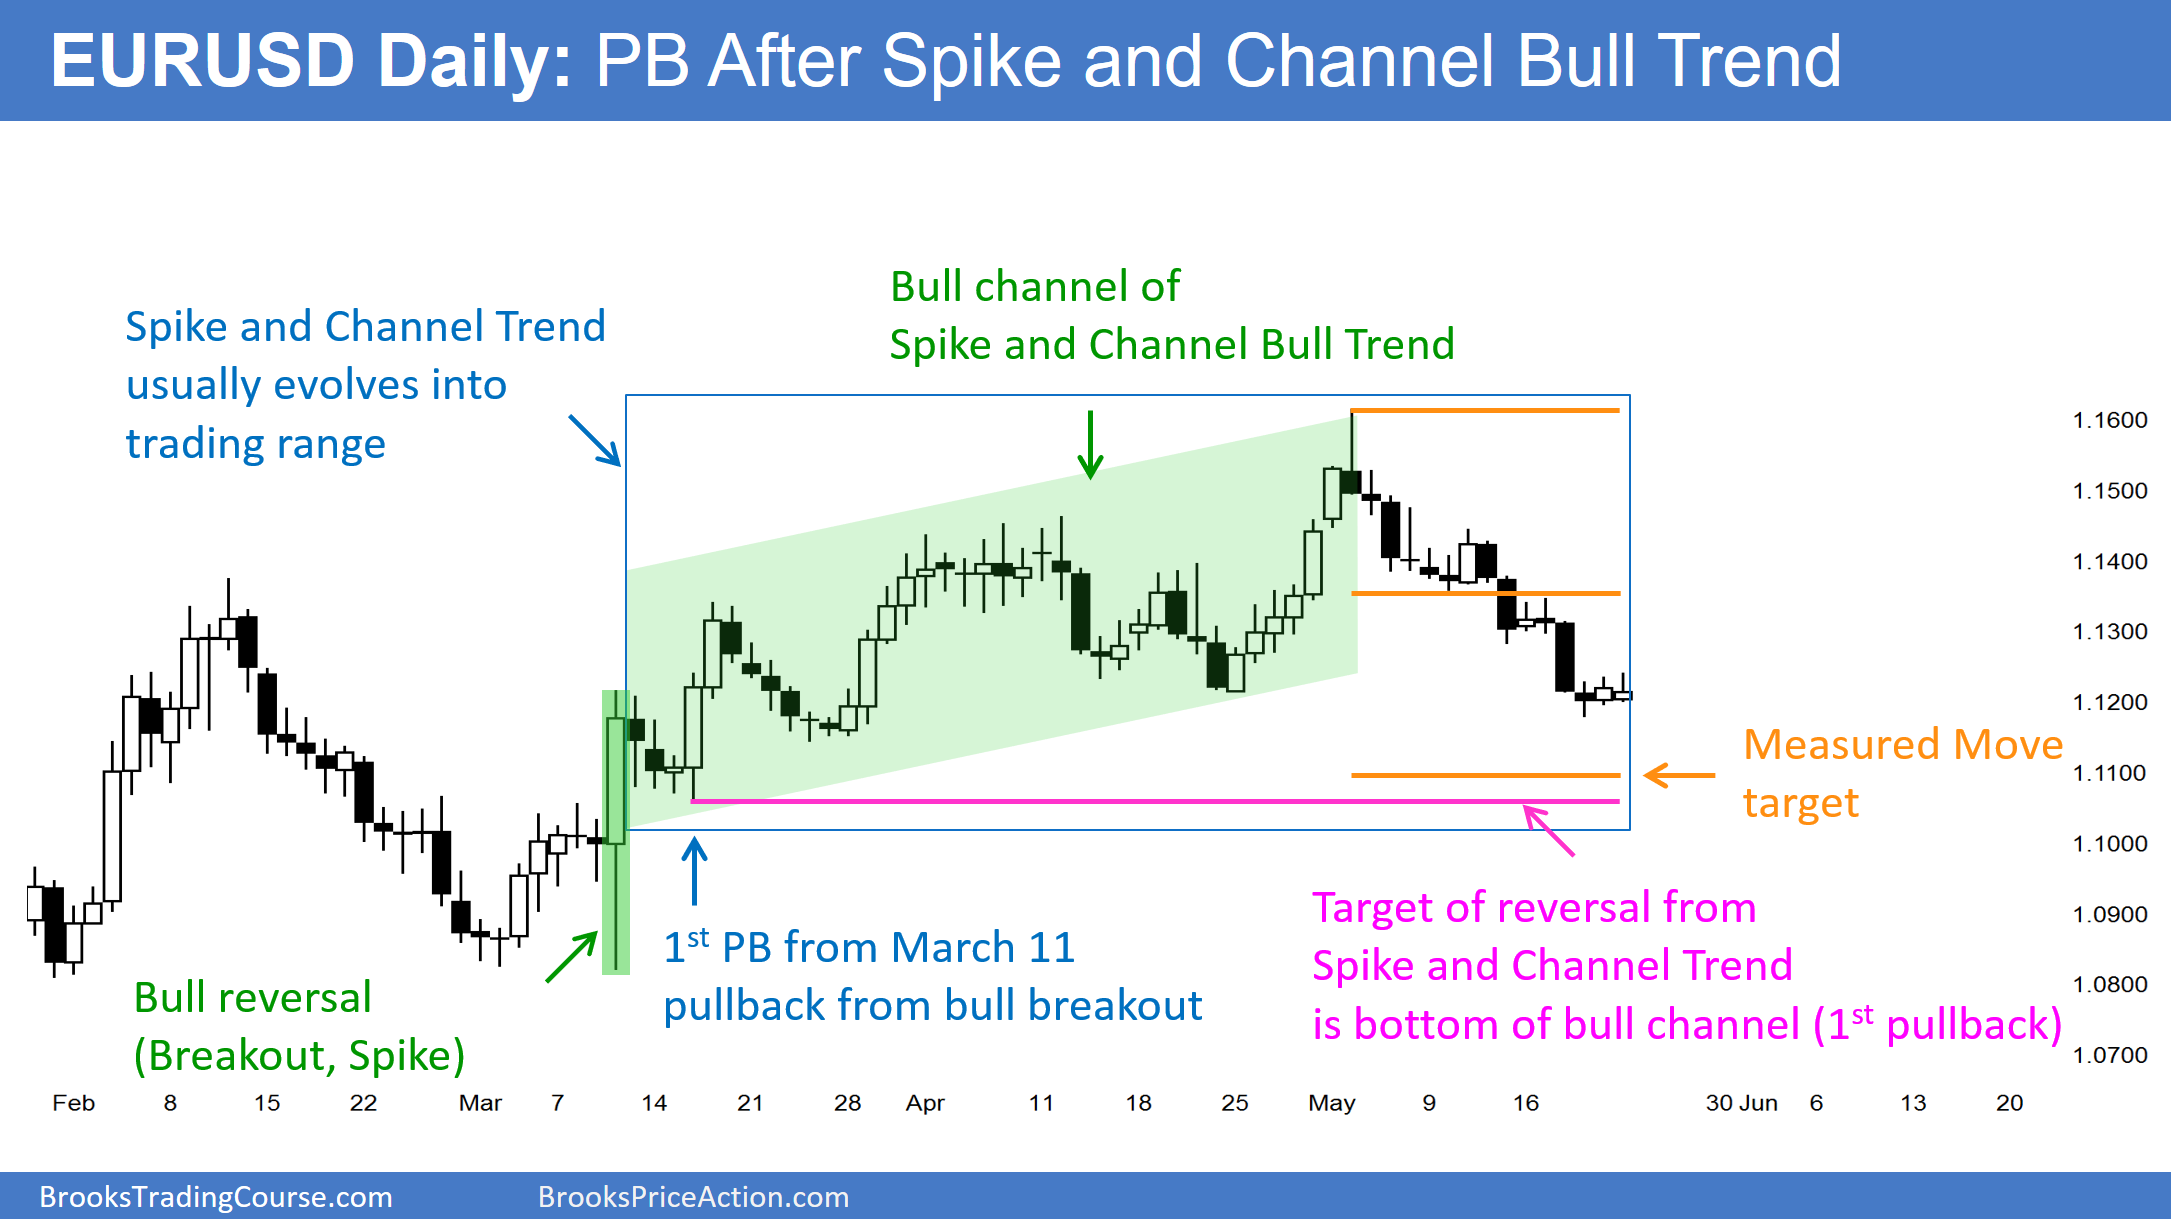
The daily chart of the EUR/USD is correcting after a spike and channel bull trend. Bull channels usually evolve into trading ranges. The pullback is often to the bottom of the 1st pullback after the bull reversal (the spike), and the EUR/USD is close to that target.

It is also close to a measured move target. Both are support areas, and the EUR/USD can bounce at any time. This is especially true since the selloff has had several sell climaxes (big bear bars followed by small bull bars).

The selloff of the past 3 weeks on the daily chart is in a tight bear channel. That means that the 1st reversal up will probably be minor, and therefore only a bull leg in the trading range. There will probably be sellers above who will create a lower high.

If it does bounce, it might retrace about 50% of the selloff. Bears will then begin to sell, betting on a head and shoulders top (the April 12 high would be the left shoulder). Trading ranges always have credible bull and bear patters. The bulls would see a double bottom with the March 16 pullback after the March 10 bull reversal (spike).

Because the daily chart has fallen in a series of sell climaxes, it will probably bounce this week. With the FOMC meeting on June 24, the odds are that the trading range will probably continue up to the report. It might then have a big breakout up or down.

3rd party Ad. Not an offer or recommendation by Investing.com. See disclosure here or remove ads .

Since the monthly chart has a double top bear flag at the 20 month moving average, the bears have a slight advantage. However, it might take many more months before the bears win, if they are to win. In the meantime, the bulls on the daily chart can continue to create legs up and down.

Since the daily chart is oversold and at support, it probably will try to bounce this week. There is still a measured move target below at around 1.1100, and the bounce might not come until after the measured move is tested. If it comes before and is not too strong, the measured move magnet might still draw the market down to it before the bulls can test up to the middle of the 2 month range.

If this selloff is a resumption of the bear trend on the monthly chart, it could fall relentlessly for several months. However, this strong selling is not yet present on the daily chart, and a trading range is more likely over the next few weeks.

Latest comments

Please....speak in figures....if it bounces where do you see it at? 1.12????? 1.3????? 1.4?????
correction 1,12???? 1.13???? 1.14????
I mentioned that around a 50% PB would be a common outcome, which might then create a right shoulder of a head and shoulders top.
The god of Forex , has spoken. This is nicely done. appreciate your analysis.
Risk Disclosure: Trading in financial instruments and/or cryptocurrencies involves high risks including the risk of losing some, or all, of your investment amount, and may not be suitable for all investors. Prices of cryptocurrencies are extremely volatile and may be affected by external factors such as financial, regulatory or political events. Trading on margin increases the financial risks.
Before deciding to trade in financial instrument or cryptocurrencies you should be fully informed of the risks and costs associated with trading the financial markets, carefully consider your investment objectives, level of experience, and risk appetite, and seek professional advice where needed.
Fusion Media would like to remind you that the data contained in this website is not necessarily real-time nor accurate. The data and prices on the website are not necessarily provided by any market or exchange, but may be provided by market makers, and so prices may not be accurate and may differ from the actual price at any given market, meaning prices are indicative and not appropriate for trading purposes. Fusion Media and any provider of the data contained in this website will not accept liability for any loss or damage as a result of your trading, or your reliance on the information contained within this website.
It is prohibited to use, store, reproduce, display, modify, transmit or distribute the data contained in this website without the explicit prior written permission of Fusion Media and/or the data provider. All intellectual property rights are reserved by the providers and/or the exchange providing the data contained in this website.
Fusion Media may be compensated by the advertisers that appear on the website, based on your interaction with the advertisements or advertisers.
© 2007-2024 - Fusion Media Limited. All Rights Reserved.