EUR/USD
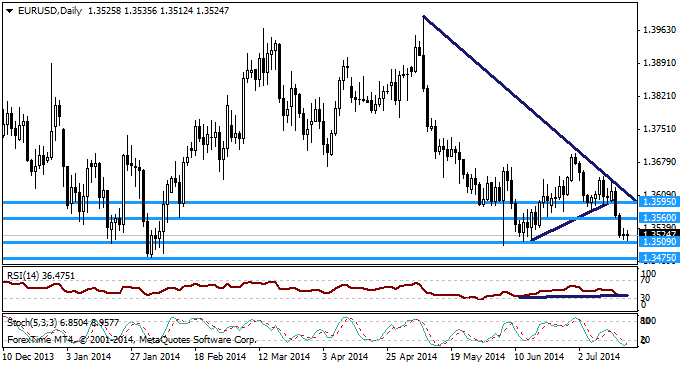
The potential short-term bullish trend line that began to formulate the week prior turned out to be exactly that, a short-term bull. EU economic data continued to showcase current weaknesses within the EU economy and last Thursday, the EUR/USD dropped to 1.3490 for the first time since February. The latest Euro-Zone Trade Balance and German ZEW Survey both missed expectations. Additionally, Mario Draghi reiterated during his testimony to the EU Parliament on Monday evening that he felt the EUR/USD was currently overvalued.
Overall, the EUR/USD lost nearly 100 pips throughout the past week. Further losses were possibly spared by comments from ECB Governing Council member, Ardo Hansson that Quantitative Easing (QE) is not a tool he personally feels the ECB needs to introduce. Hansson also suggested that perhaps that introduction of QE might not be needed at all.
In regards to the upcoming week, the largest quantity of EU economic data is released on Thursday. This includes the latest Spanish Unemployment Rate, Italian Retail Sales and Manufacturing/Services PMIs throughout the EU. It is likely that the Manufacturing/Services PMIs will continue to suggest that EU economic activity is slowing down.
However, I will refrain from saying that my prediction for this pair is necessarily bearish. It is important to consider that the latest US GDP Advance Estimate is scheduled to be released in just under a fortnight. Any US economic releases disappointing over the next week or two will likely result in anxiety over the GDP release. Therefore, risk appetite should not be ruled out the equation. No matter how bleak the EU economic sentiment might be.
Moving on to the technicals on the Daily timeframe, support levels can be found located at 1.3509 and 1.3475. Although, if you are a firm believer in the Stochastic Oscillator and RSI, this pair is now situated around the oversold boundaries and an upturn in valuation might be on the horizon. Resistance levels can be located at 1.3560 and 1.3595.
GBP/USD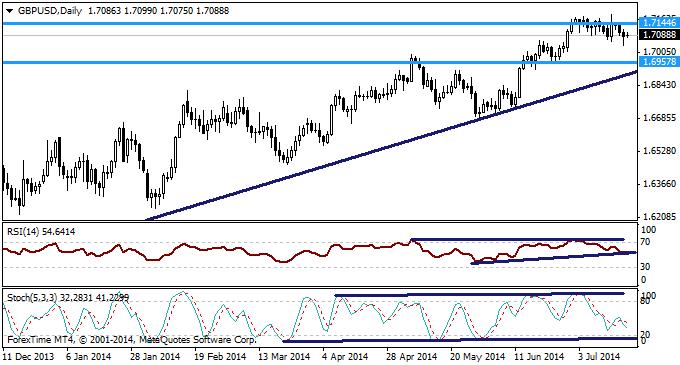
Just as it appeared that the GBP bulls were about to take a breather, a ringing alarm bell sent the bulls charging out of the gates once again. Tuesday’s UK CPI (Inflation) far surpassed expectations, with UK inflation levels rising by an annualised 1.9% in June. This bought UK CPI within .1% of the Bank of England’s (BoE) threshold CPI target to consider an interest rate increase. On Tuesday alone, the GBP/USD appreciated by over 100 pips. This included setting a new yearly high, at 1.7189.
Unfortunately for the GBP bulls, their rally to the upside was relatively short-lived.
Following the UK CPI release, anticipation was high for the latest UK employment report. Although the employment report showed that UK Jobless Claims continued to decrease in June, the overall UK unemployment rate remained unchanged at 6.5%. Recently, BoE Governor, Mark Carney hinted that an unemployment rate below 6% might influence the Central Bank’s decision to raise interest rates. Due to the UK unemployment rate remaining unchanged, the GBP/USD concluded the week with three days of consecutive losses.
Looking ahead to next week, there is a high quantity of economic data to be released from the United Kingdom. This includes CBI Optimism on Tuesday and the latest BoE Minutes on Wednesday. Thursday sees the latest Retail Sales released and following the old cliché, perhaps the best will be left to last. On Friday, the latest GDP from the United Kingdom is announced.
In regards to the technicals on the Daily timeframe, a bullish trend line continues to dictate the overall direction of this pair. Despite the GBP/USD concluding the week with three days of successive losses, the GBP/USD bull’s resilience to take control at any stage is proving impressive and I am refraining from offering a bearish outlook.
If the bearish momentum does continue, further support is located at 1.7019 and 1.6957. Resistance levels are situated at 1.7101 and 1.7144, while last week’s yearly high remains at 1.7189.
In quick reference to the momentum indicators, the Stochastic Oscillator appears to be heading towards the oversold boundaries, while the RSI is teasing the end of a near 3-month trading range.
USD/JPY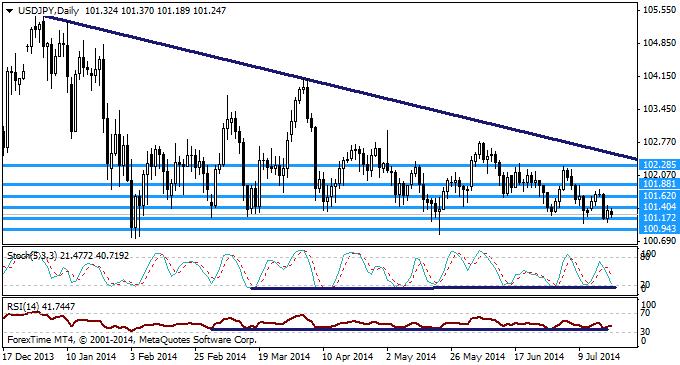
The USD/JPY continued to trade in another narrow range. At the beginning of the week, the pair seemed to be advancing, before Janet Yellen’s comments during the second day of her testimony to the US Senate Committee weakened the USD/JPY momentum. Yellen mentioned that she felt that the US economy still requires QE support, and the markets reacted unfavourably to this comment. It is also highly likely that the JPY was used as a safe-haven, following the tragedy in Eastern Europe on Thursday evening.
Looking ahead to next week, there is a greater variety of economic data released from the United States. Therefore, it would appear that US news is going to dictate the next direction of the USD/JPY. On Tuesday, the latest US CPI (Inflation) data is released. This is then followed by Initial Jobless Claims on Thursday and the latest Durable Goods Orders on Friday.
In regards to Japanese economic news, their latest CPI data is released on Friday morning. The sales tax implemented in April has correlated in the past two CPI releases fluctuating. If this Friday’s CPI shows that Japanese economic data is about to slow down, bullish moves are likely.
In regards to the technicals (Daily), a bearish trend line remains in control of the USD/JPY’s direction. USD/JPY support levels remain at 101.172 and 100.943.
On the other hand, resistance levels can be found located at 101.620 and 101.881.
AUD/USD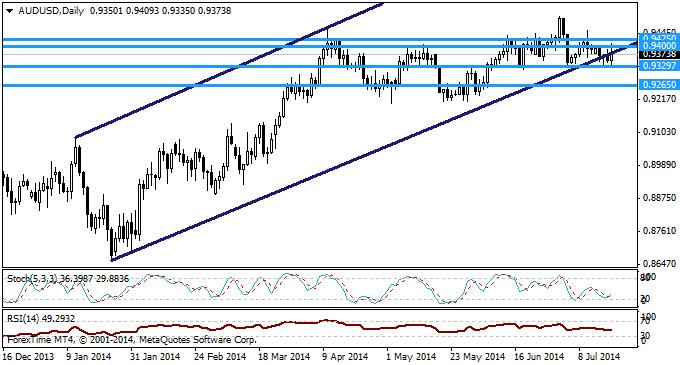
At the time of writing, it appears that the Reserve Bank of Australia (RBA) may have been successful in their attempts to devalue the AUD/USD. Looking at my Daily timeframe, a bullish trend line which has been in play since the beginning of the year is now in jeopardy of conclusion. The development of a further one or two candlesticks below the trend line are needed for confirmation.
Tuesday’s RBA Minutes release continued to show that the Australian Central Bank continues to display a negative outlook for the Australian economy. Comments made during the minutes release included, their currency being historically high, the Australian economy remaining on track to enter a period of weaker economic growth, alongside noticing a decline in domestic consumer confidence levels.
However, it was only after China’s GDP was recorded above expectations that the AUD/USD began to experience bearish movement. This is strange to notice because in theory, as China’s main trading partner, this news should have boosted the AUD/USD valuation.
In regards to the upcoming week, the latest Australian CPI (inflation) released on Wednesday morning should be considered high risk.
My theory behind this is that back in May, when the RBA transitioned to a more dovish tone, the Central Bank suggested that not only was their economy set to enter a period of weaker than expected economic growth, but also reduced inflation levels.
In order to confirm that the next AUD/USD direction will be bearish and that this is not just the start of another consolidation period forming, further evidence of selling is necessary. Support levels can be found at 0.9329 and 0.9265.
However, if what appears to be developing into a broken trend line is just a false signal and the AUD/USD appreciates in valuation, resistance levels can be found at 0.9400 and 0.9425. The RSI currently seems to be ranging.
NZD/USD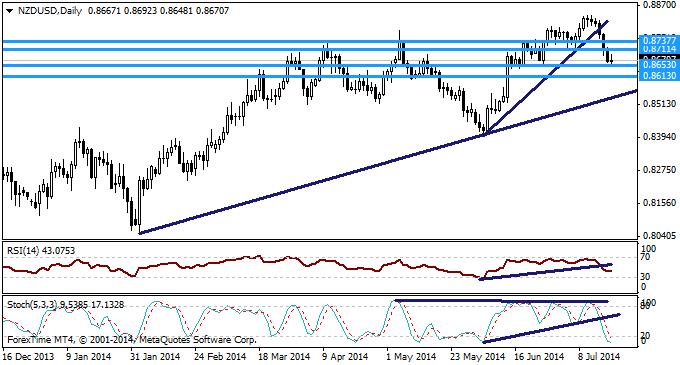
The penny for this pair finally dropped. A week prior, the NZD/USD was only 30 pips or so away from recording a new 3-year high. As the old saying goes, so close but yet so far.
The NZD/USD dropped nearly 130 pips after the latest New Zealand CPI fell below expectations. The Reserve Bank of New Zealand (RBNZ) had previously warned in May that an appreciated currency would lead to reduced inflation levels, but investors seemed to refrain from taking note of this warning.
Expectations have now decreased for a RBNZ rate hike this coming Wednesday, and this means the pair is in for another exciting week. It is not by any means certain that the RBNZ will delay an interest rate hike this week and according to Bloomberg, there is still over a 70% chance of an interest rate hike.
This pair will be fun to watch over the next week, that’s for sure.
In regards to the technicals on the Daily timeframe, the disappointing New Zealand CPI reading encouraged a clean break of a 3-month bullish trend line. If the bearish movement does continue and the RBNZ refrain from raising interest rates, a final touch on the second trend line attached in the image would provide confirmation of a further bullish trend line.
Support levels can be found located at 0.8653 and 0.8613. Resistance is situated at 0.8714 and 0.8737.
Disclaimer: The content in this article comprises personal opinions and ideas and should not be construed as containing personal and/or other investment advice and/or an offer of and/or solicitation for any transactions in financial instruments and/or a guarantee and/or prediction of future performance. ForexTime Ltd, its affiliates, agents, directors, officers or employees do not guarantee the accuracy, validity, timeliness or completeness of any information or data made available and assume no liability as to any loss arising from any investment based on the same.
Risk Warning: There is a high level of risk involved with trading leveraged products such as forex and CFDs. You should not risk more than you can afford to lose, it is possible that you may lose more than your initial investment. You should not trade unless you fully understand the true extent of your exposure to the risk of loss. When trading, you must always take into consideration your level of experience. If the risks involved seem unclear to you, please seek independent financial advice.
