Get 40% Off
⚠ Earnings Alert! Which stocks are poised to surge?
See the stocks on our ProPicks radar. These strategies gained 19.7% year-to-date.
Unlock full list

Forex Technical Analysis: USD/JPY

Published 06/19/2014, 09:37 AM
Updated 12/18/2019, 06:45 AM

USD/JPY H4

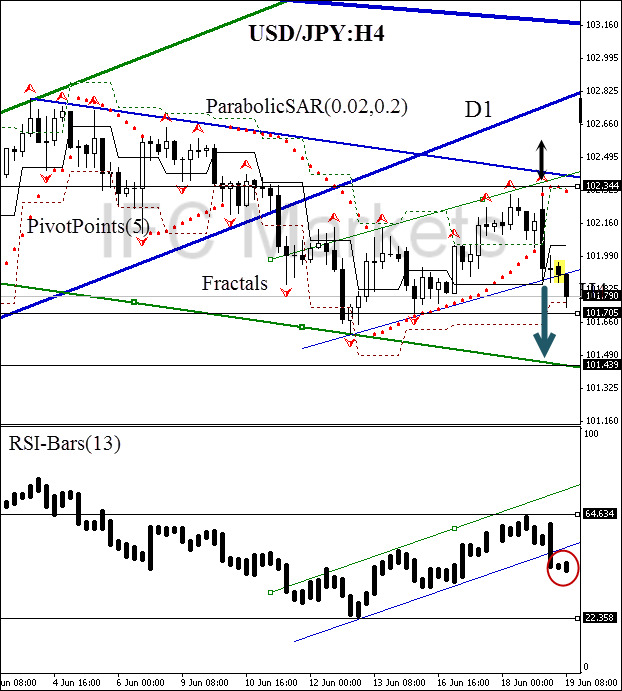
Here we consider the currency pair USD/JPY on the H4 chart. The price moves within the daily bearish trend, and broke through the H4 downwards. It happened after the formation of the "balance" candlestick pattern. This pattern is marked with yellow on the chart and indicates the completion of a short-term correction. The ParabolicSAR trend indicator turned up before crossing the PivotPointssignal line. It is worth mentioning the RSI consistency: the uptrend breakthrough is duplicated by the RSI-Bars oscillator. That allows us to talk with confidence about the continuation of the downtrend.

Pending sell order is to be preliminary placed below the key fractal minimum at 101.705. This level is confirmed by the PivotPointshistorical support. Stop Loss can be chosen at the last fractal high at 102.344, which coincides with the historical value of the ParabolicSAR indicator and the first PivotPoints support. Opening a position, it is recommended to move the Stop loss after the parabolic values every 4 hours after the order execution. Thus, we can optimize the return/risk ratio in our favor in the process of changing market conditions. Conservative traders can partially close the position at 101.439. If you decide to take a break from the market, the automatic Trailing Stop can be placed, taking the distance between the two previous fractal peaks into account. This distance is indicated by the double arrow on the chart above.

Latest comments

Risk Disclosure: Trading in financial instruments and/or cryptocurrencies involves high risks including the risk of losing some, or all, of your investment amount, and may not be suitable for all investors. Prices of cryptocurrencies are extremely volatile and may be affected by external factors such as financial, regulatory or political events. Trading on margin increases the financial risks.
Before deciding to trade in financial instrument or cryptocurrencies you should be fully informed of the risks and costs associated with trading the financial markets, carefully consider your investment objectives, level of experience, and risk appetite, and seek professional advice where needed.
Fusion Media would like to remind you that the data contained in this website is not necessarily real-time nor accurate. The data and prices on the website are not necessarily provided by any market or exchange, but may be provided by market makers, and so prices may not be accurate and may differ from the actual price at any given market, meaning prices are indicative and not appropriate for trading purposes. Fusion Media and any provider of the data contained in this website will not accept liability for any loss or damage as a result of your trading, or your reliance on the information contained within this website.
It is prohibited to use, store, reproduce, display, modify, transmit or distribute the data contained in this website without the explicit prior written permission of Fusion Media and/or the data provider. All intellectual property rights are reserved by the providers and/or the exchange providing the data contained in this website.
Fusion Media may be compensated by the advertisers that appear on the website, based on your interaction with the advertisements or advertisers.
© 2007-2024 - Fusion Media Limited. All Rights Reserved.