
When a high of whatever degree is being reached there is very often a first spike downwards that signals that the push is coming to an end. SPX (or whatever) often recovers back to make a new high, but the seed has been sown and a larger retracement arrives shortly thereafter. I think that’s what we saw yesterday in all likelihood.
What makes things a bit less comfortable now is that in May at the high then, I could state with real confidence that we were not looking at a possible bull market top because there was no negative divergence on the weekly RSI. Now that those highs have been tested, and until this bull market ends as and when, that will no longer be the case, and any interim top will need to be considered as a potential bull market top. I don’t think that bull market top is close, but that’s something to bear in mind.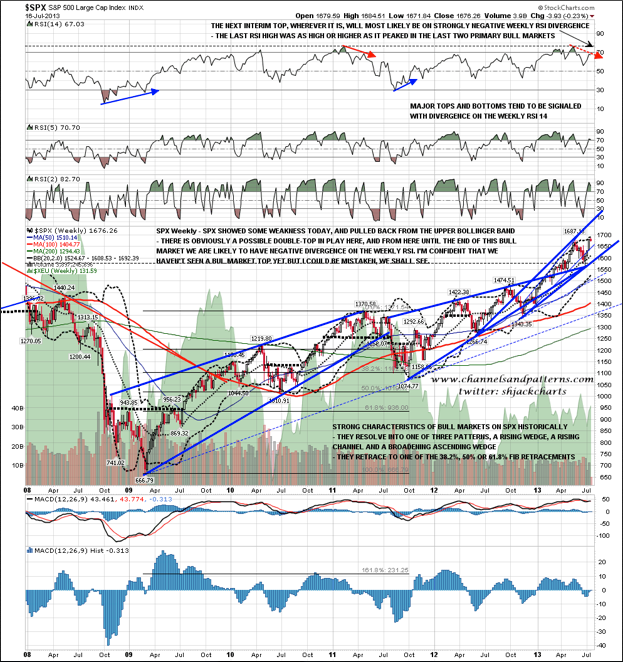
SPX closed 16 points under the daily upper bollinger band yesterday, so SPX is no longer riding the band upwards. For reasons I’ll explain below a deeper retracement starting very soon looks likely so the first support level and target is rising support from the June low in the 1660-5 area and if that is broken, then the next support levels and targets are the 50-DMA, currently in the 1635 area, and the daily middle bollinger band in the 1630 area.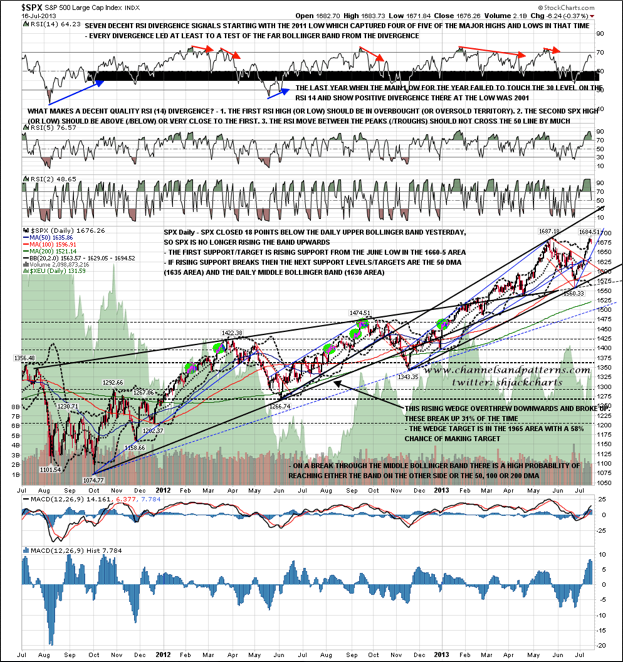
On the SPX 60-min. the rising wedge from 1604 broke down yesterday and after assessing the setups on my spread of 8 US equity indices I think it is clear that SPX is forming a rising wedge rather than the rising channel that had looked promising. Main rising wedge support is the next obvious target and that is in the 1660-5 area.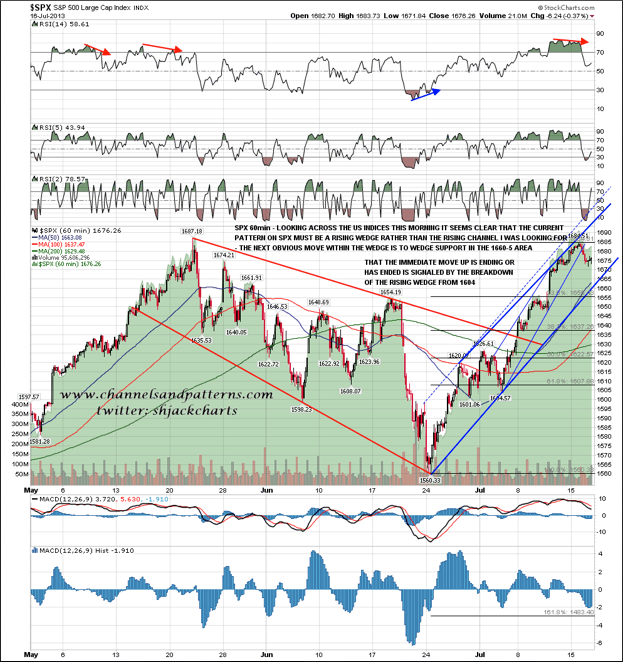
I’m running late today, which is a shame because there was a very nice looking W bottom setup when I capped the ES chart with a target at 1679.75 and I was going to highlight this nice looking long setup. As it happens that that target has now almost been made while I was writing though on the plus side at least I got to play it for a very nice start to my morning. I am looking for a hit of that target on ES today and ideally a new high on SPX over the current 1687.18 high. That would be an attractive looking short entry if we get it.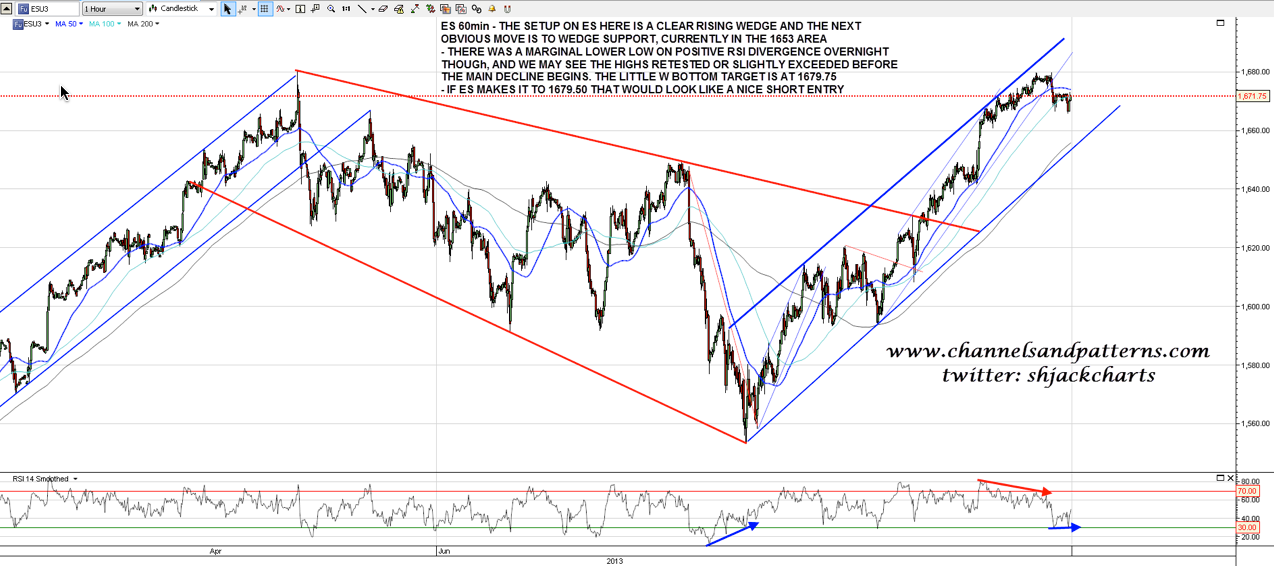
I posted the short term declining channel on 5th July with the comment that I wasn’t expecting it to break up yet as there was no clear bottoming pattern. The updated version below shows that bottoming pattern which is now part-formed , and the TLT declining channel is now breaking up. As I have been saying every day, this is a nice long setup within a larger nice long setup. The W bottom target is the 115.40 area on a clear break over 110.80.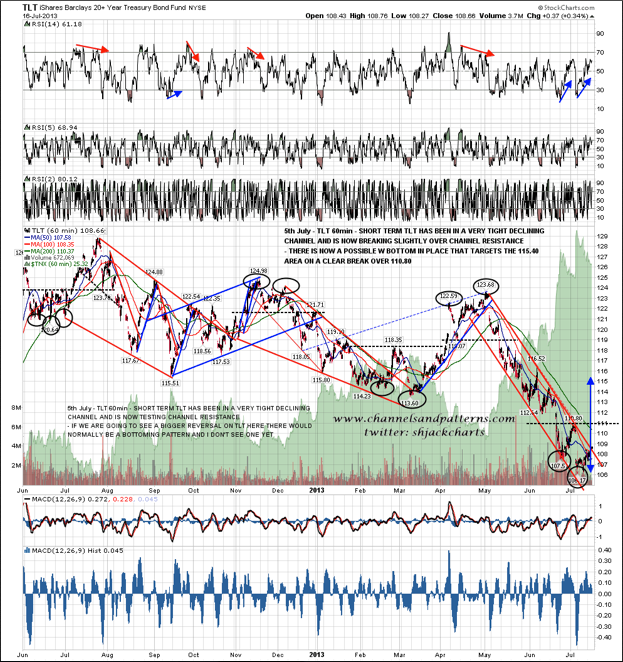
I’m out of time so I won’t post the GBP/USD chart today, though I’ll note that the rally there is extending as expected, and I’m watching for signs of reversal. I’ll close today with the CL chart, where I am looking for the second high of a double-top. Ideally that second top would be a marginal new high but we might not get that.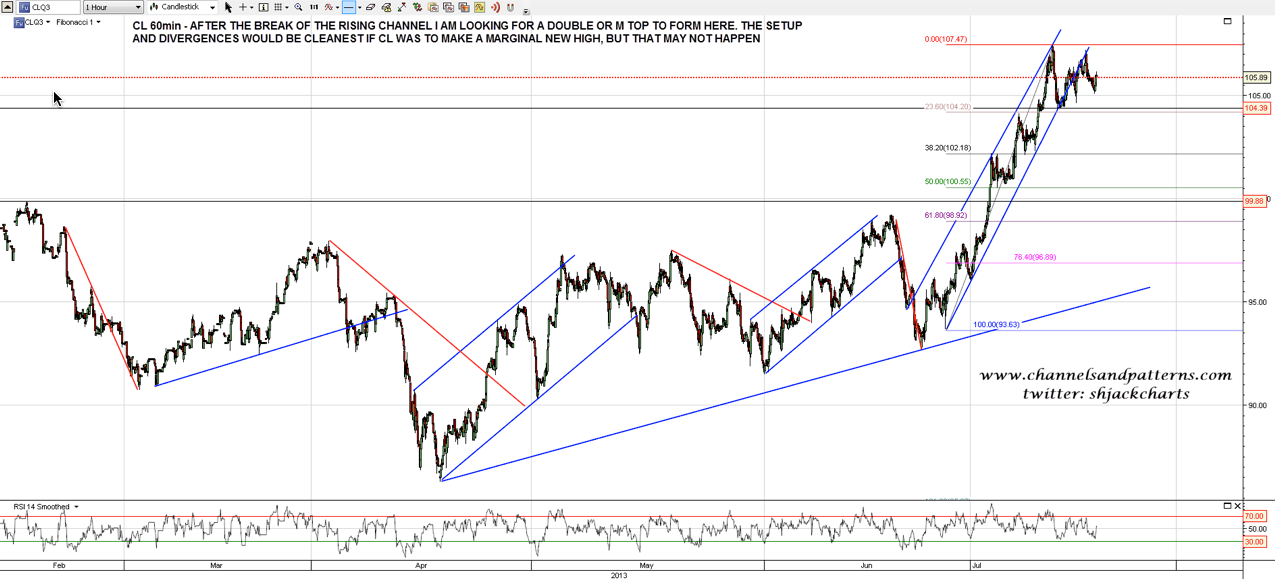
I would like to see a new high on SPX today. If so then that would most likely be the second high of a short term double-top, and I would be seeing that as an opportunity to short into strength. I don’t think it is likely that this is a very significant high but we’ll get a better idea about that from the form of retracement.
- English (UK)
- English (India)
- English (Canada)
- English (Australia)
- English (South Africa)
- English (Philippines)
- English (Nigeria)
- Deutsch
- Español (España)
- Español (México)
- Français
- Italiano
- Nederlands
- Português (Portugal)
- Polski
- Português (Brasil)
- Русский
- Türkçe
- العربية
- Ελληνικά
- Svenska
- Suomi
- עברית
- 日本語
- 한국어
- 简体中文
- 繁體中文
- Bahasa Indonesia
- Bahasa Melayu
- ไทย
- Tiếng Việt
- हिंदी
First Spike Down
Published 07/17/2013, 11:32 AM
Updated 07/09/2023, 06:31 AM
First Spike Down
Latest comments
Install Our App
Risk Disclosure: Trading in financial instruments and/or cryptocurrencies involves high risks including the risk of losing some, or all, of your investment amount, and may not be suitable for all investors. Prices of cryptocurrencies are extremely volatile and may be affected by external factors such as financial, regulatory or political events. Trading on margin increases the financial risks.
Before deciding to trade in financial instrument or cryptocurrencies you should be fully informed of the risks and costs associated with trading the financial markets, carefully consider your investment objectives, level of experience, and risk appetite, and seek professional advice where needed.
Fusion Media would like to remind you that the data contained in this website is not necessarily real-time nor accurate. The data and prices on the website are not necessarily provided by any market or exchange, but may be provided by market makers, and so prices may not be accurate and may differ from the actual price at any given market, meaning prices are indicative and not appropriate for trading purposes. Fusion Media and any provider of the data contained in this website will not accept liability for any loss or damage as a result of your trading, or your reliance on the information contained within this website.
It is prohibited to use, store, reproduce, display, modify, transmit or distribute the data contained in this website without the explicit prior written permission of Fusion Media and/or the data provider. All intellectual property rights are reserved by the providers and/or the exchange providing the data contained in this website.
Fusion Media may be compensated by the advertisers that appear on the website, based on your interaction with the advertisements or advertisers.
© 2007-2024 - Fusion Media Limited. All Rights Reserved.