The majority of Americans may be financially and economically illiterate. Many have nothing, and likely will never have anything. Over 65% of American adults have a net worth under $100,000. In Australia, over 65% of all adults have a net worth exceeding $100,000.
The recent 2013 Consumer Financial Literacy Survey shows the financial literacy trends are getting worse:
In fact, as in 2011 and 2012, many adults (40% 2013, 42% 2012, 41% 2011) now give themselves a grade of C, D, or F on their knowledge of personal finance, marking a statistically significant change from 2010, when as many as nearly 2 in 3 adults (65%) gave themselves an A or B.
Yet when we look at data, it seems like wealth in America is growing, and recovered or recovering from the Great Recession. 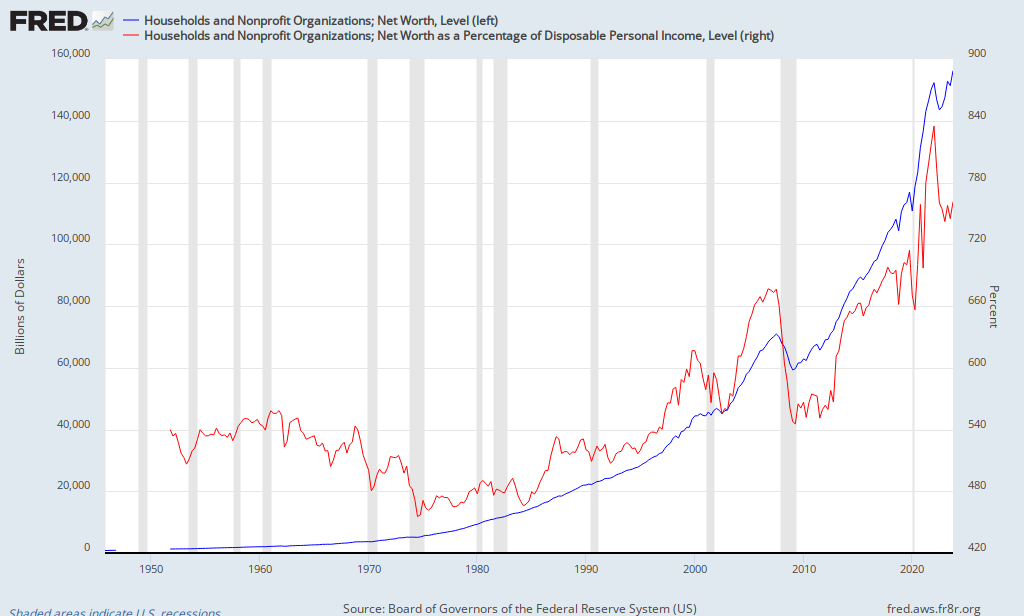
The per capita wealth of the average American is over $220,000 (blue line in below graph). This is true capital building, and refutes that the average American is not a good wealth builder.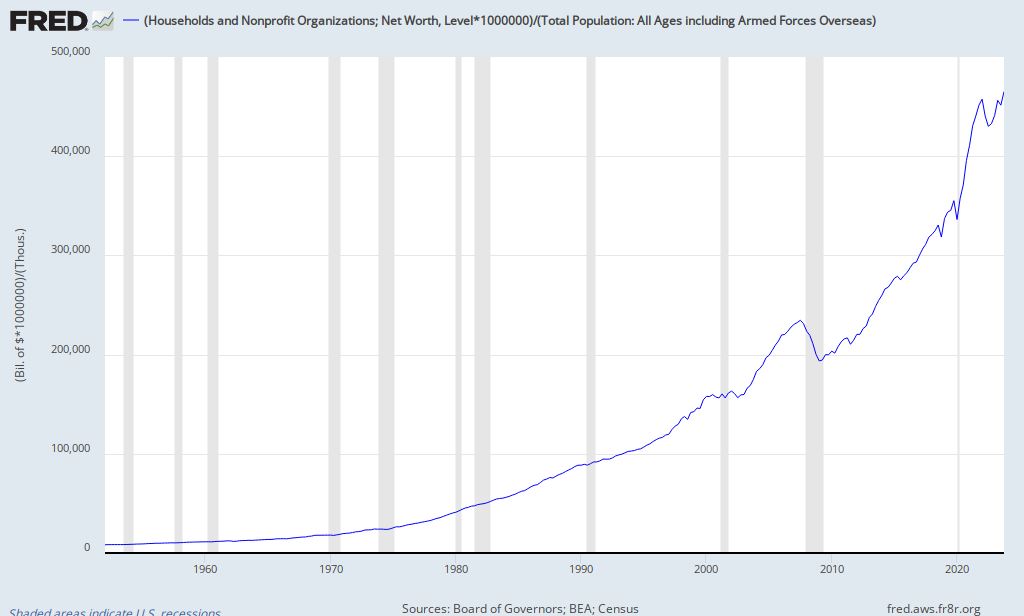
This graph above showed average net worth, but gives no understanding of median wealth (the wealth of the 50th percentile American).
Few people are natural born wealth builders. Many watch their parents build or not build wealth. The median American’s net worth not good – in fact it is terrible when you compare it to other countries. The following table has been cut-and-pasted from the 2012 Credit Suisse Global Wealth Databook to give a relevant thumbnail comparison between the USA, and is just a small sample of countries in this report.
Pick your reason why the 50th percentile (median) American is so poor – education system, bad parenting, religion, nanny government, lazy sods, suppression by the 1%. Grab any prejudice and believe it – because no one can prove it wrong. The data simply does not exist to prove anything. Even so, this type of data only defines the problem, and not the cause.
But a solution is necessary as the lagging trend shows degrading median wealth (from the few data points that exist). Weakening of the majority of the population weakens the system as a whole.
The modern world is capitalistic from Beijing Financial Street to Wall Street. The first ingredient in capitalism is capital – and the USA is trending towards a situation where capital only resides in the hands of a smaller and smaller minority of the population.
What good is rising average wealth if more and more people are below average?
Other Economic News this Week:
The Econintersect economic forecast for June 2012 again declined marginally, and remains under a zone which would indicate the economy is about to grow normally. The concern is that consumers are spending a historically high amount of their income.
The ECRI WLI growth index value has been weakly in positive territory for over four months – but in a noticeable improvement trend. The index is indicating the economy six month from today will be slightly better than it is today.
Current ECRI WLI Growth Index 
Initial unemployment claims improved from 346,000 (reported last week) to 343,000 this week. Historically, claims exceeding 400,000 per week usually occur when employment gains are less than the workforce growth, resulting in an increasing unemployment rate.
The real gauge – the 4 week moving average – improved from 345,750 (reported last week) to 345,500. Because of the noise (week-to-week movements from abnormal events AND the backward revisions to previous weeks releases), the 4-week average remains the reliable gauge.
Weekly Initial Unemployment Claims – 4 Week Average – Seasonally Adjusted – 2011 (red line), 2012 (green line), 2013 (blue line)
Bankruptcies this Week: Excel Maritime Carriers, Cengage Learning, Unigene Laboratories, Residential Capital
Data released this week which contained economically intuitive components (forward looking) were:
- Rail movements are beginning to show a modest growth trend.
All other data released this week either does not have enough historical correlation to the economy to be considered intuitive, or is simply a coincident indicator to the economy.
Weekly Economic Release Scorecard:
Click here to view the scorecard table below with active hyperlinks